Fig. 1
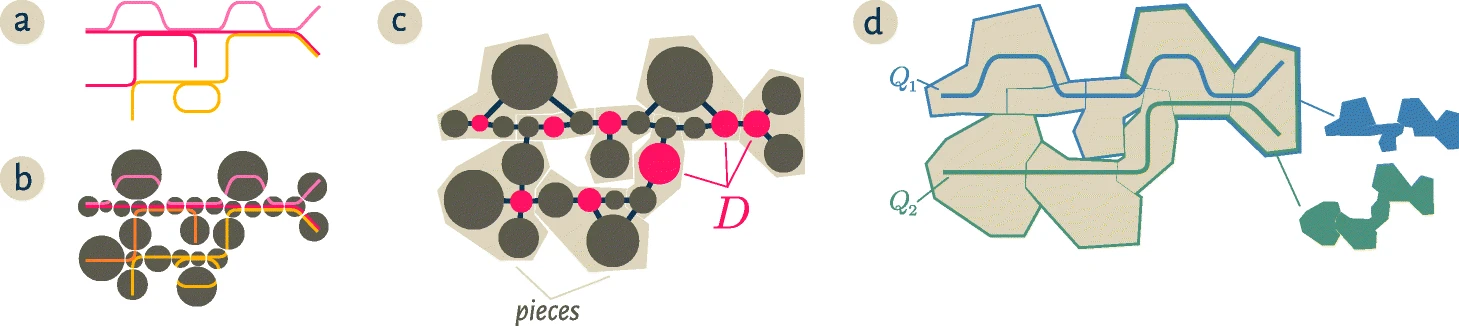
Starting from a collection of genomic sequences (a), we form an assembly graph where nodes represent distinct linear subsequences (b). In this assembly graph, known as a compact De Bruijn graph [4], nodes may represent many k-mers. The original genomic sequences correspond to walks in the graph, and shared nodes between the walks represent shared subsequences. c We then identify a subset of nodes D called a dominating set so that every node in the assembly graph is at distance at most one from some member of D (marked pink). We further partition the graph into pieces by assigning every node to exactly one of the closest members of D (beige regions in c and d). For a genomic query Q, the neighborhood of Q in this graph is the union of all pieces which share at least one k-mer with the query. The colorful subsets of the pieces in d correspond to the neighborhoods of the queries Q1,Q2