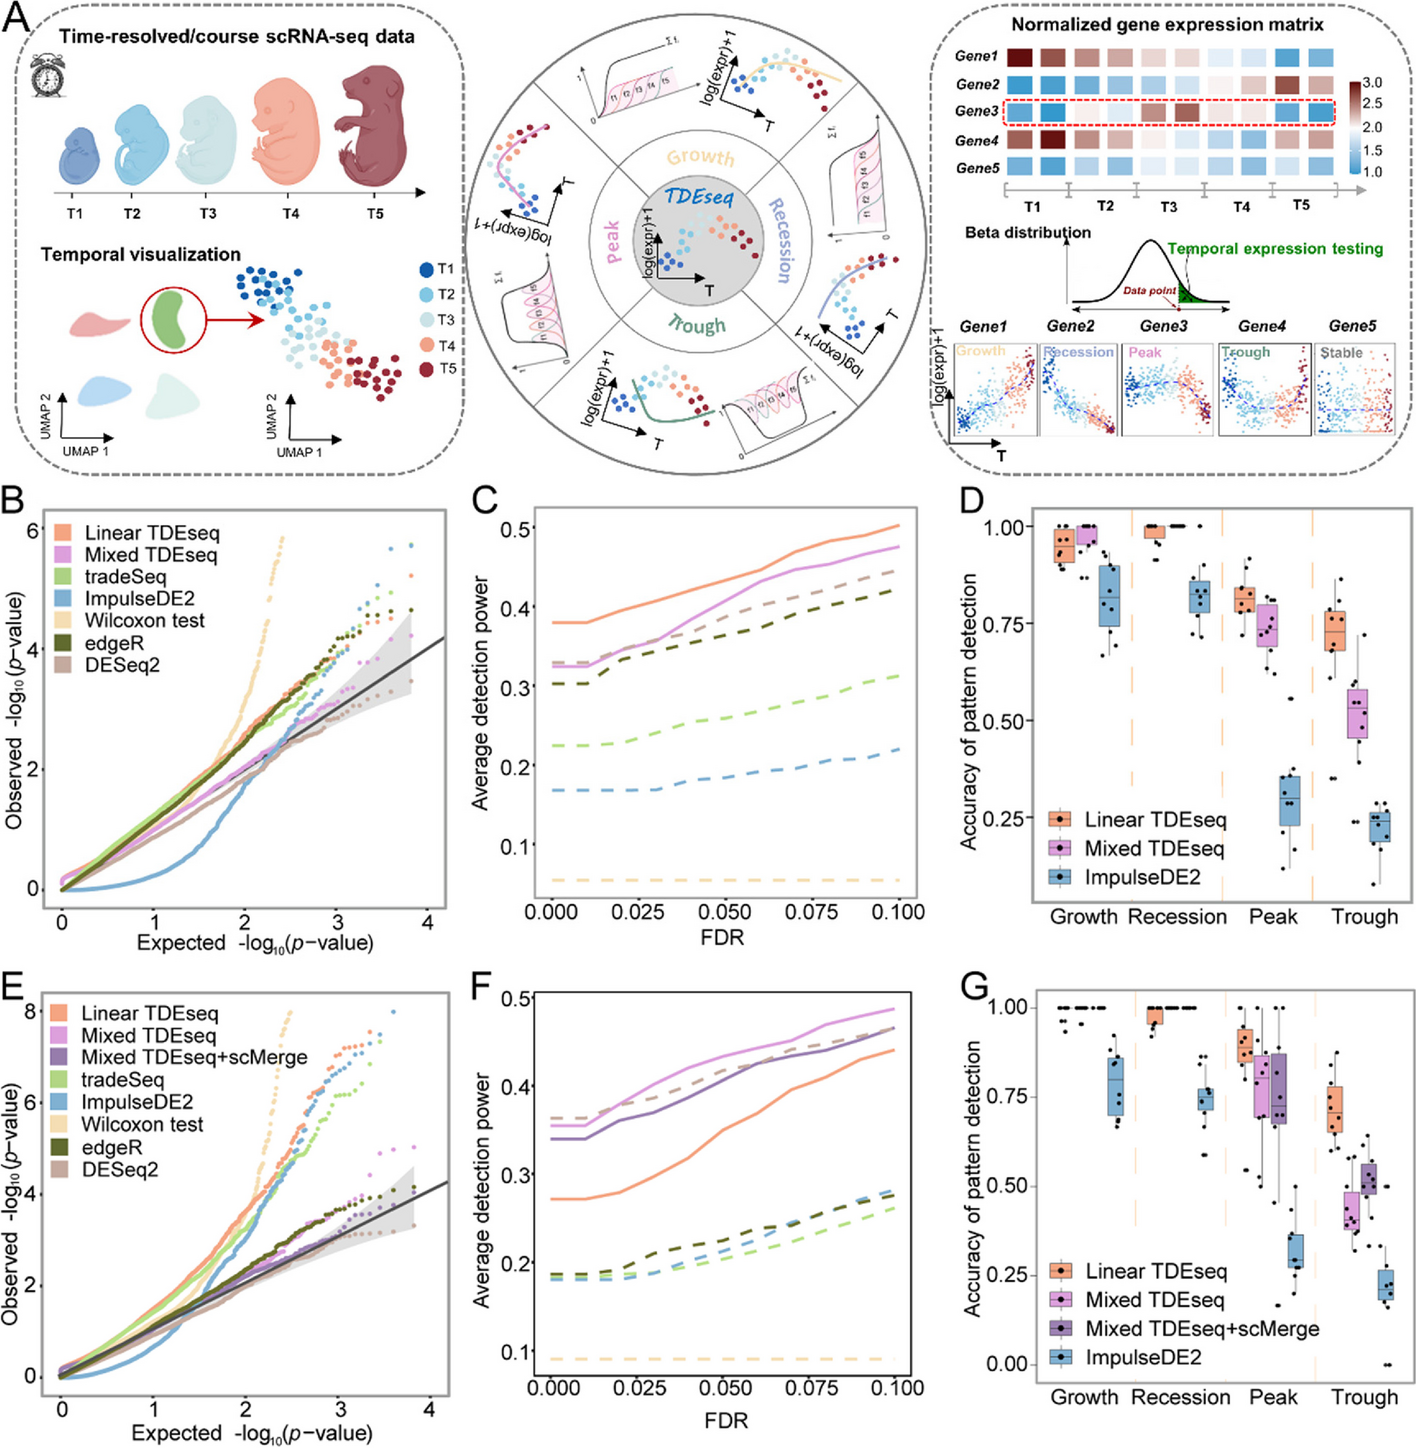
Fig. 1

Schematic overview of TDEseq and the methods comparison in simulations. A TDEseq is designed to perform temporal expression gene analysis of time-course scRNA-seq data. With a given gene, TDEseq determines one of four temporal expression patterns, i.e., growth, recession, peak, and trough. TDEseq combines the four p-values using the Cauchy combination rule as a final p-value, facilitating the detection of temporal gene expression patterns. B The quantile–quantile (QQ) plot shows the type I error control under the baseline parameter settings. The well-calibrated p-values will be expected laid on the diagonal line. The p-values generated from Mixed TDEseq (plum) and DESeq2 (brown) are reasonably well-calibrated, while Linear TDEseq (orange), tradeSeq (green), ImpulseDE2 (blue), Wilcoxon test (yellow) and edgeR (dark green) produced the p-values that are not well-calibrated. C The average power of 10 simulation replicates for temporal expression gene detection across a range of FDR cutoffs under the baseline parameter settings. Both versions of TDEseq exhibit high detection power of temporal expression genes, followed by DESeq2, edgeR, tradeSeq, and ImpulseDE2. Wilcoxon test does not fare well, presumably due to bias towards highly expressed genes. The TDEseq methods were highlighted using solid lines, while other methods were represented by dashed lines in the plots. D The comparison of Linear TDEseq, Mixed TDEseq, and ImpuseDE2 in terms of the accuracy of temporal expression pattern detection under the baseline parameter settings, at an FDR of 5%. The temporal expression genes detected by TDEseq demonstrated a higher accuracy than those detected by ImpluseDE2. E The quantile–quantile (QQ) plot shows the type I error control under the large batch effect parameter settings. The p-values generated from Mixed TDEseq coupled with scMerge (purple) and DESeq2 (brown) are reasonably well-calibrated, while Linear TDEseq (orange), Mixed TDEseq (plum), tradeSeq (green), ImpulseDE2 (blue), Wilcoxon test (yellow), and edgeR (dark green) generated the inflated p-values. F The average power of 10 simulation replicates the comparison of temporal expression gene detection across a range of FDR cutoffs under the large batch effect parameter settings. G The comparison of Linear TDEseq, Mixed TDEseq, and Mixed TDEseq coupled with scMerge and ImpuseDE2 in terms of the accuracy of temporal expression pattern detection under the large batch effect parameter settings, at an FDR of 5%. Since DESeq2, edgeR, tradeSeq, and Wilcoxon tests were not originally designed for pattern-specific detection we excluded them in the comparison. FDR denotes the false discovery rate
