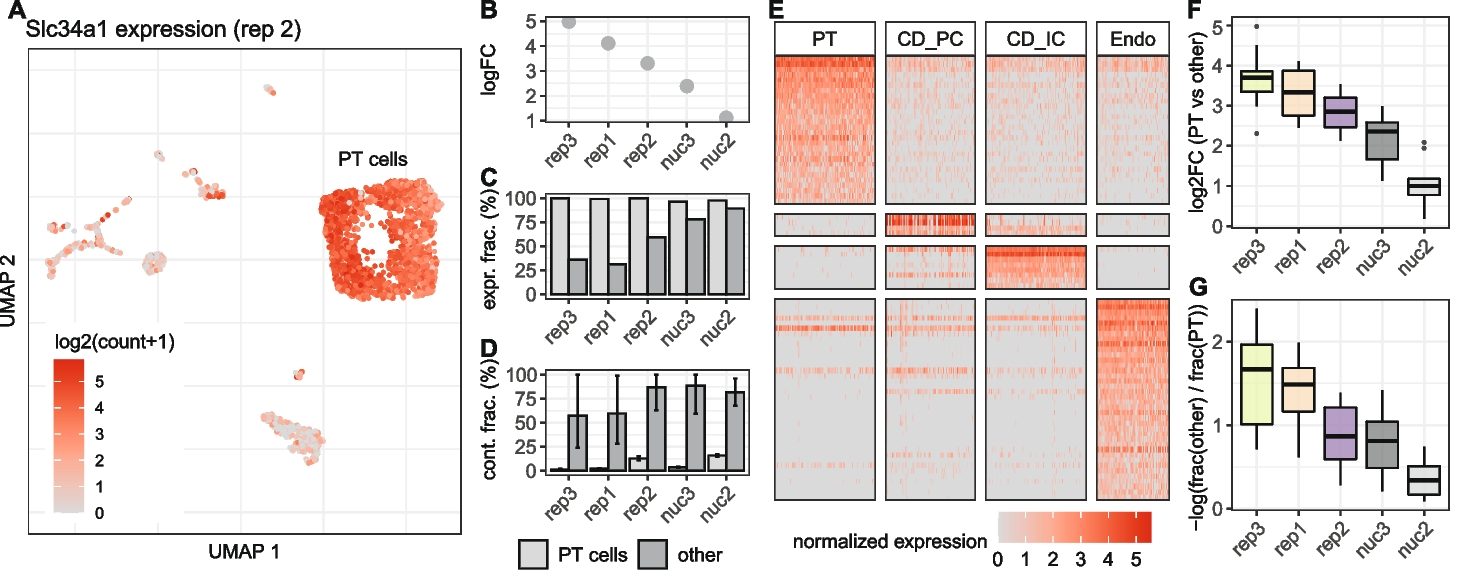
Fig. 4
From: The effect of background noise and its removal on the analysis of single-cell expression data

Background noise affects differential expression and specificity of cell type specific marker genes. A UMAP representation of replicate 2 colored by the expression of Slc34a1, a marker gene for cells of the proximal tubule (PT). Besides high counts in a cluster of PT cells, Slc34a1 is also detected in other cell type clusters. Differential expression analysis between PT and all other cells shows a decrease of the detected log fold change of Slc34a1 (B) at higher background noise levels, as well as an increase of the fraction of non PT cells in which UMI counts of Slc34a1 were detected (C). D Estimation of the background noise fraction of Slc34a1 expression indicates that the majority of counts in non PT cells originates from background noise. Error bars indicate 90% profile likelihood confidence intervals. E Heatmap of marker gene expression for four cell types in replicate 2, downsampled to a maximum of 100 cells per cell type. F Comparison across replicates of log2 fold changes of 10 PT marker genes calculated based on the mean expression in PT cells against mean expression in all other cells. G For the same set of genes as in E, the log ratio of fraction of cells in which a gene was detected in others and PT cells shows how specific the gene is for PT cells
