Fig. 18
From: A benchmark of batch-effect correction methods for single-cell RNA sequencing data
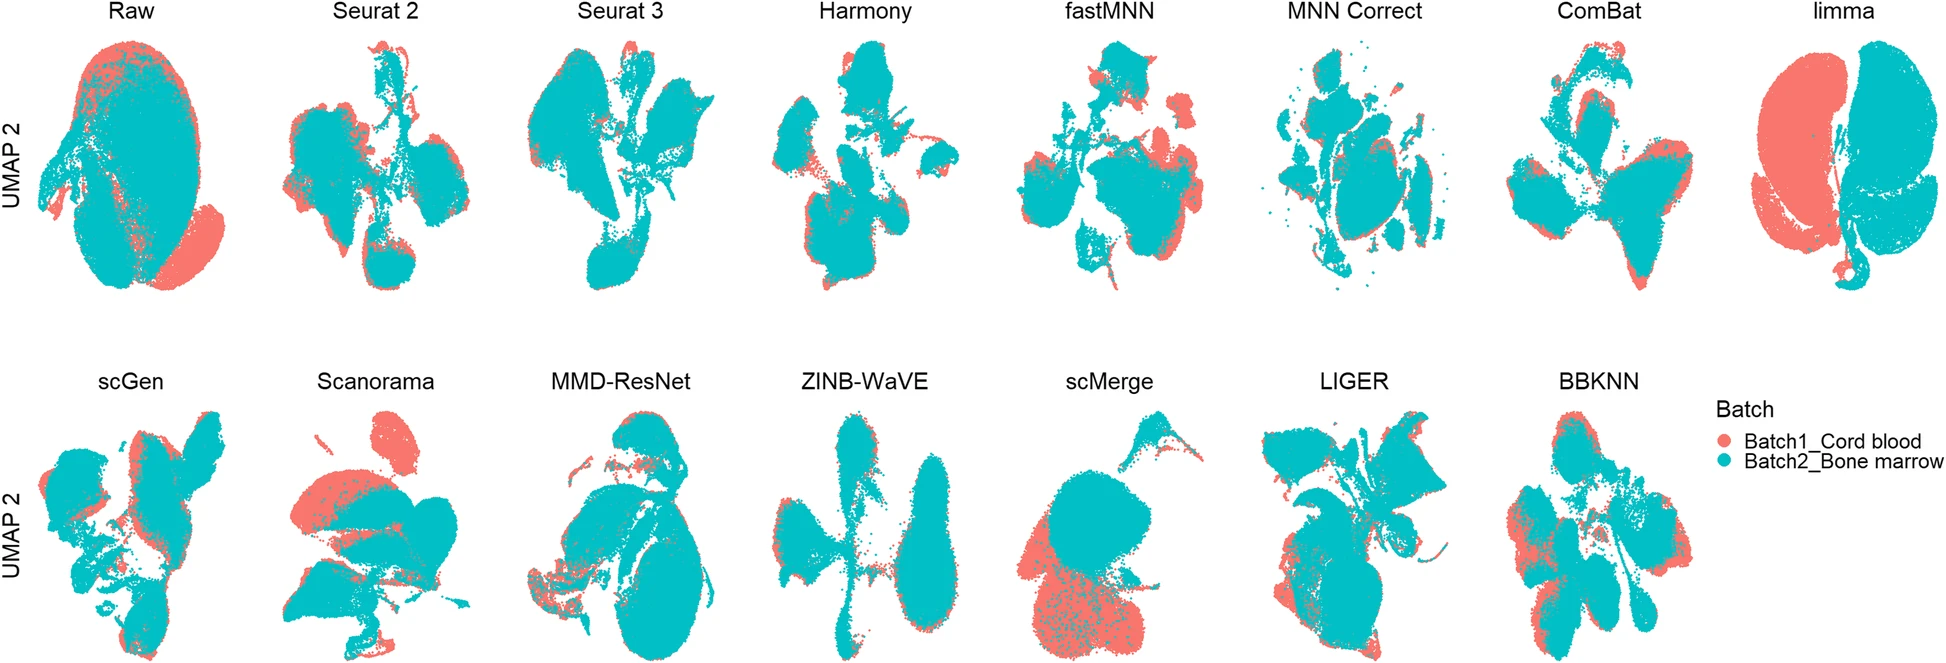
Qualitative evaluation of 14 batch-effect correction methods using UMAP visualization for dataset 9 of human cell atlas. The 14 methods are organized into two panels, with the top panel showing UMAP plots of raw data, Seurat 2, Seurat 3, Harmony, fastMNN, MNN Correct, ComBat, and limma outputs, while the bottom panel shows the UMAP plots of scGen, Scanorama, MMD-ResNet, ZINB-WaVE, scMerge, LIGER, and BBKNN outputs. Cells are colored by batch