Fig. 1

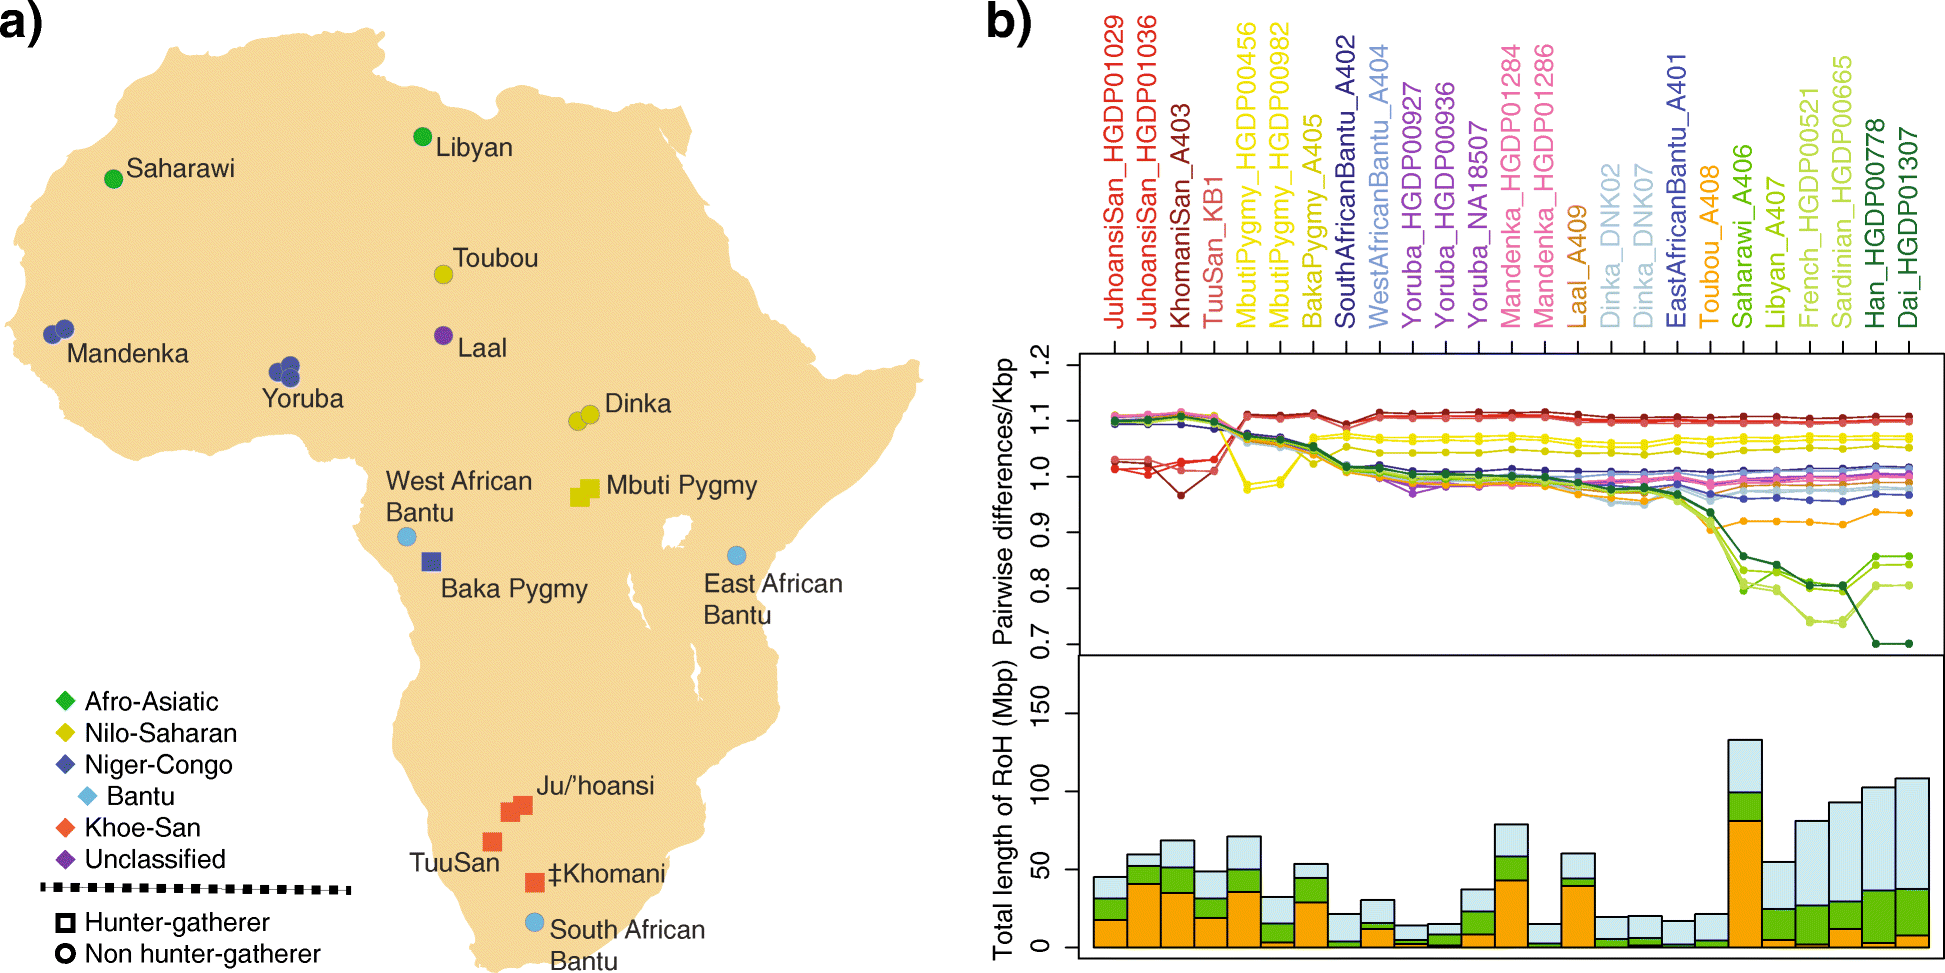
Samples, genetic diversity, and runs of homozygosity. a Geographical, linguistic and life-style distribution of African individuals analyzed. b On the top, pairwise differences per kbp between individuals. Each line corresponds to the genetic differences of a specific individual to the rest of the samples. The line color corresponds to the label color of the individual in the x axis. The value given for the same individual is counted considering differences between its two chromosomes. On the bottom, total length of runs of homozygosity per individual. In blue, smaller lengths (from 0.5 to 1 Mbp); in green, intermedium lengths (from 1 to 1.5 Mbp) and in orange, the largest windows (bigger than 1.5 Mbp), the latter are a sign of inbreeding at population or individual level
