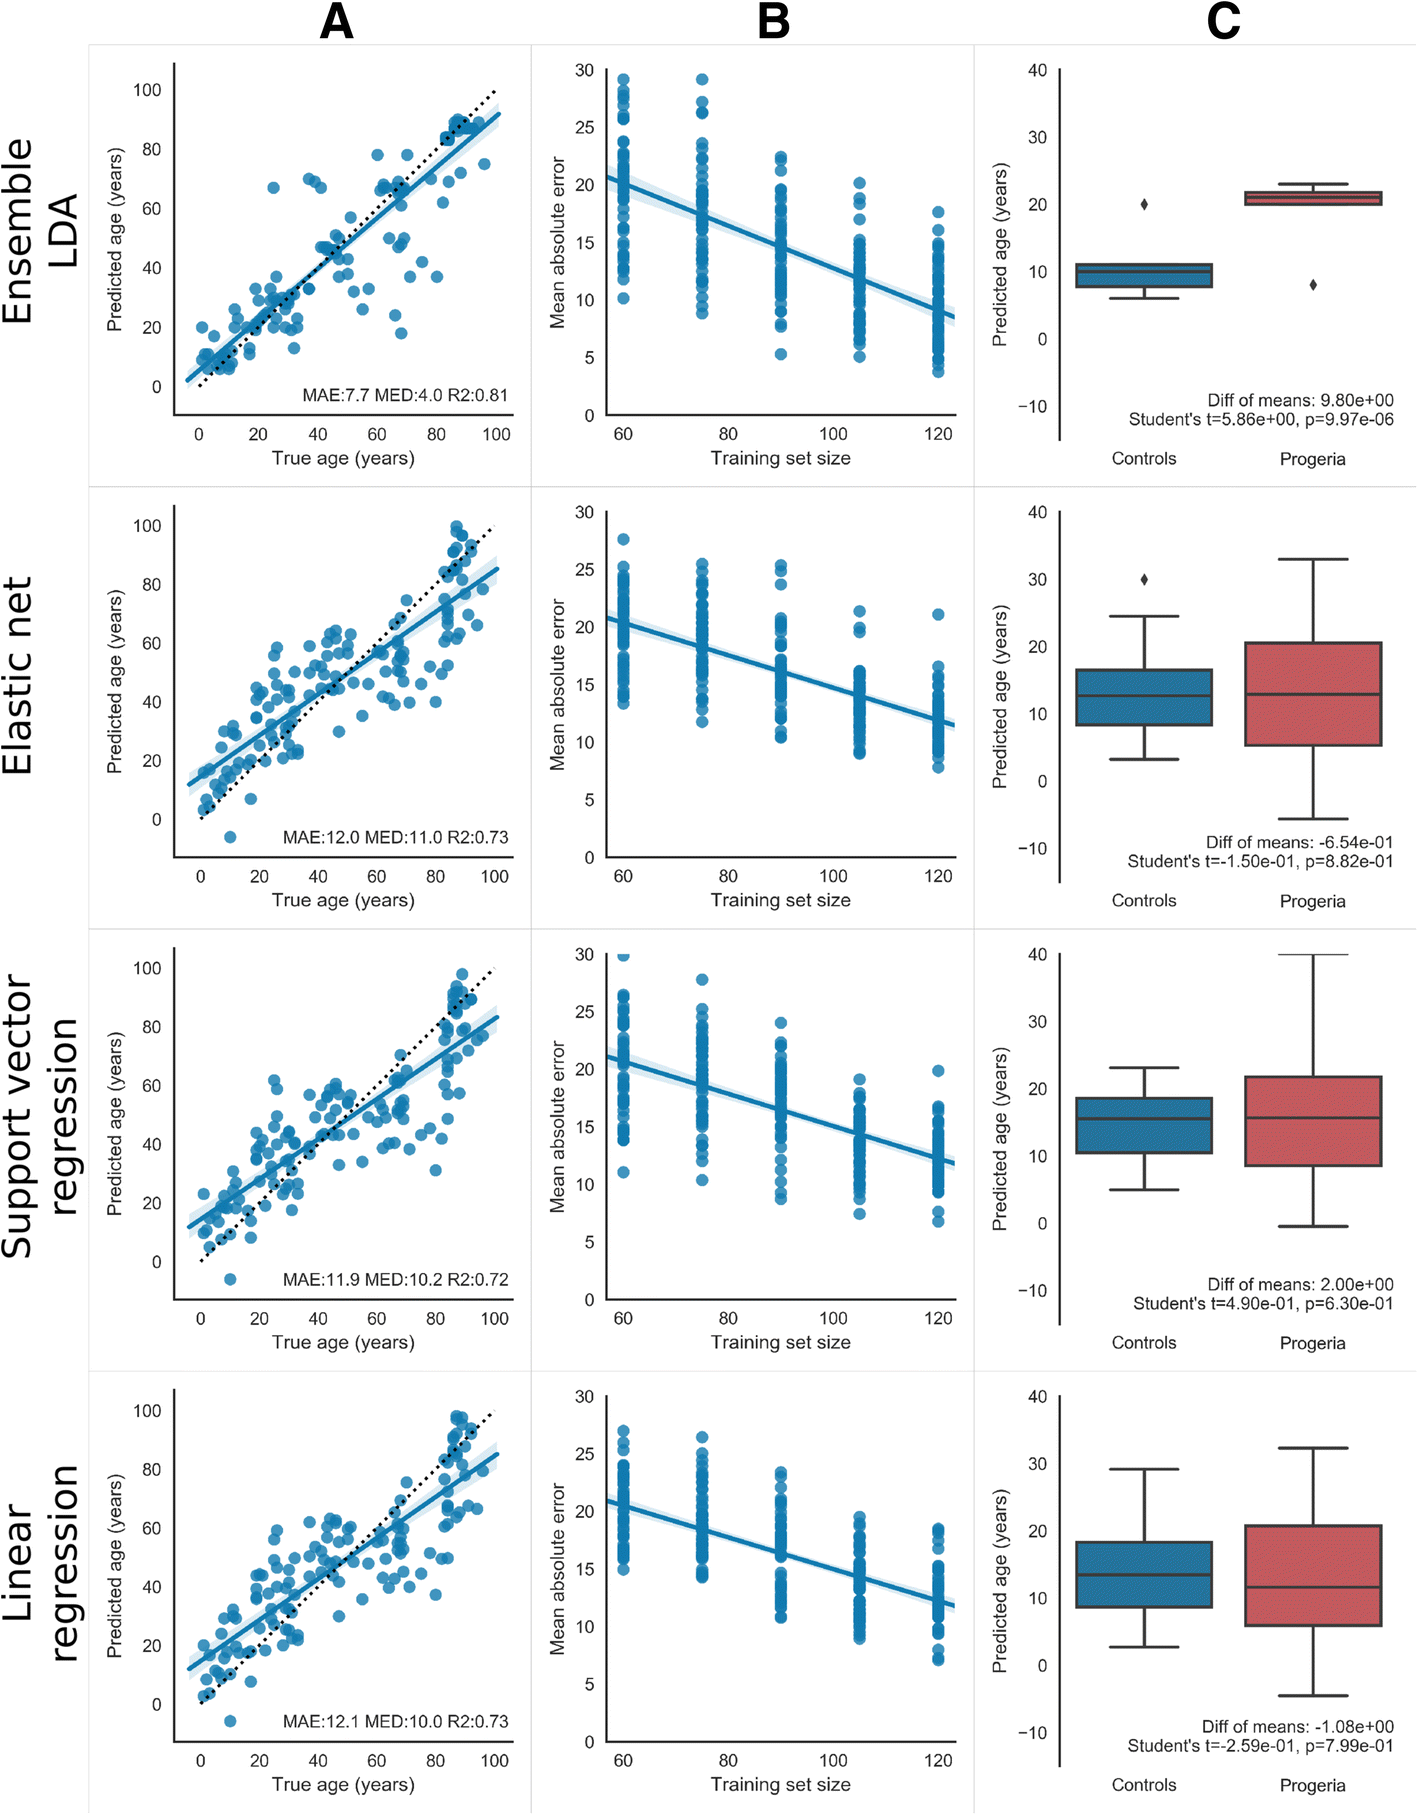
Fig. 1
From: Predicting age from the transcriptome of human dermal fibroblasts

Predicting age from gene expression data. Rows from top to bottom show age prediction results for LDA Ensemble with 20-year age bins, elastic net, linear regression, and support vector regression. Model parameters are shown in Table 1. Column (A): Leave-one-out cross-validation predictions for 133 healthy individuals. Dots are plotted for each individual showing predicted age (y-axis) vs. true age (x-axis), with a line of best fit overlaid, and a shadow showing the 95% confidence interval of that line determined through bootstrap resampling of the dots. Text on the bottom of each panel shows performance metrics of mean absolute error (MAE), median absolute error (MED), and R2 goodness-of-fit for the line of best fit. The dotted line is the ideal line, where true age equals predicted age. Column (B): The effect of training set size (x-axis) on the mean absolute error of the ensemble (y-axis). The slope of the best fit line indicates the rate at which age prediction error would decrease with additional samples. Dots indicate mean absolute error from each fold of 2 × 10 cross-validation (y-axis) for varying sizes of random subset of the data (x-axis). A line of best fit and 95% confidence interval is shown. Column (C): Box plots of age predictions of progeria patients (red) and leave-one-out cross-validation predictions of age-matched healthy controls (blue). Box limits denote 25th and 75th percentiles, line is median, whiskers are 1.5× interquartile range, and dots are predictions outside the whisker’s range. The ensemble method is the only method that predicts significantly higher ages for progeria patients. Progeria patients: n = 10, mean ± std. of true age 5.5 ± 2.4; age-matched controls: n = 12, mean ± std. of true age 5.0 ± 2.9
