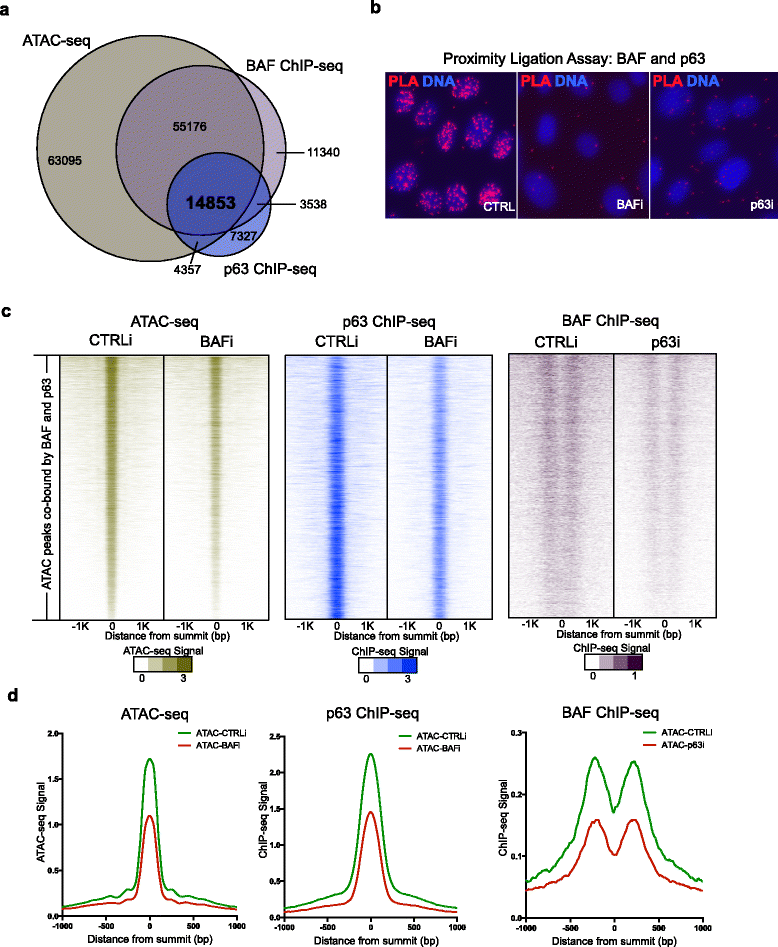
Fig. 5

BAF and p63 cooperate in chromatin binding to reinforce open chromatin. a Venn diagram showing the overlap among ATAC-seq peaks, BAF ChIP-seq peaks, and p63 ChIP-seq peaks. b Proximity ligation analysis (PLA) in wild-type (CTRL, left), BAF-depleted (BAFi, middle), or p63-depleted (p63i, right) differentiating keratinocytes. Red represents PLA proximity signal for BAF and p63; blue is the Hoechst DNA stain. c Summit-centered heatmaps of 14,853 ATAC-seq peak regions co-bound with BAF and p63, showing ATAC-seq, p63 ChIP-seq, and BAF ChIP-seq signals in BAF or p63 loss and control conditions. d Average diagram of ATAC-seq, p63 ChIP-seq, and BAF ChIP-seq signals in BAF and p63 co-bound regions. bp base pair
