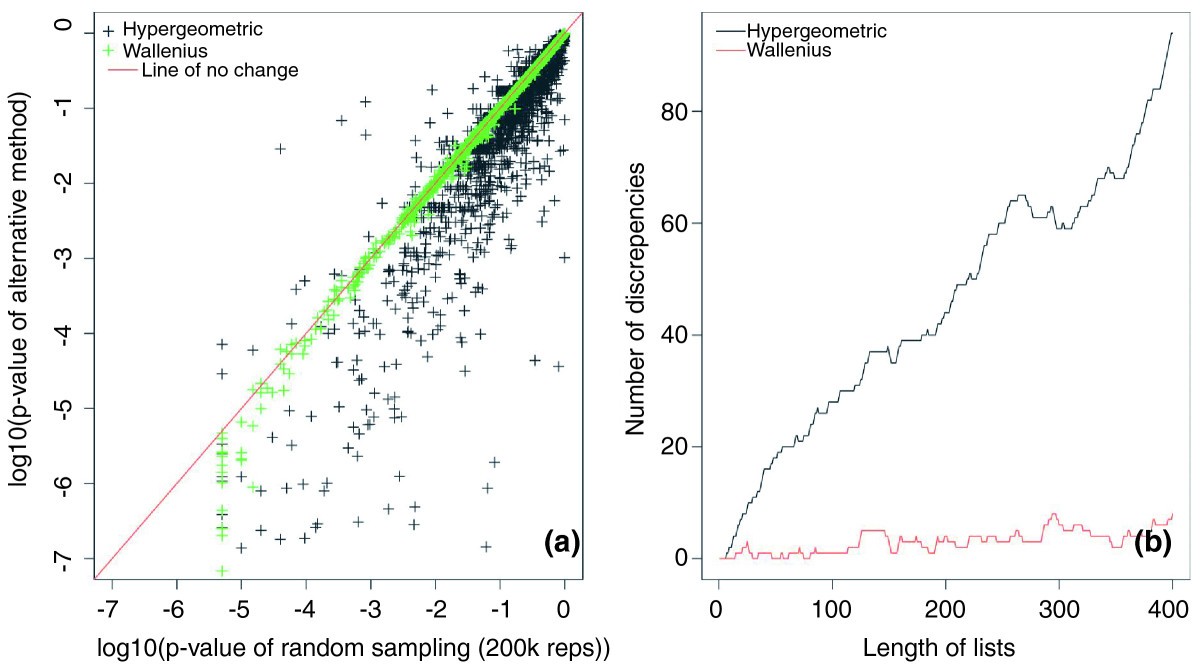
Figure 4
From: Gene ontology analysis for RNA-seq: accounting for selection bias

Comparison of GOseq and the standard hypergeometric methods. (a) The P-values generated with GOseq using the Wallenius approximation and the standard hypergeometric method are plotted against the P-values calculated with GOseq using random sampling (200k repeats). The Wallenius method (green crosses) shows good agreement with the high resolution (200,000 repeats) random sampling. A large discrepancy in P-values is seen between GOseq and the hypergeometric method. (a) The number of discrepancies between lists is shown for a given list size. The black line compares GOseq using high resolution sampling with the hypergeometric method. The red line compares GOseq using high resolution sampling with the Wallenius approximation. Again, GOseq using the Wallenius method shows little difference from GOseq using the random sampling method (with 200k repeats) while the hypergeometric method shows a large number (approximately 20%) of discrepancies.
