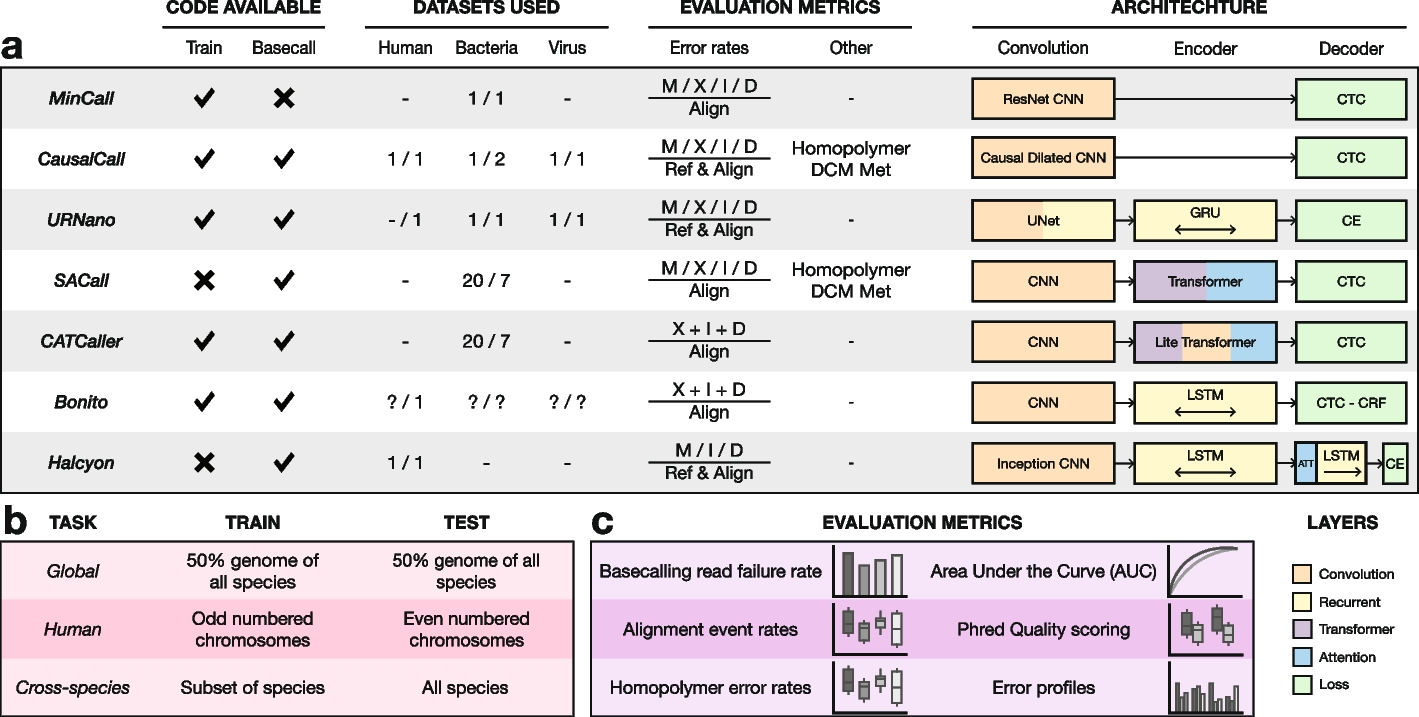
Fig. 1

Overview of the latest basecaller models and benchmark. Code available columns indicate whether their github repositories contained scripts to train a model from scratch or basecall using their trained models. Values in the datasets indicate the number of species they used for training (left) and testing (right). Alignment rates reported for matches (M), mismatches (X), insertions (I), and deletions (D) and whether they were normalized based on the length reference sequence (Ref) or the length of the alignment (Align). Metrics separated by a slash (/) are reported independently; others are reported as a combined error rate. Some models also report homopolymer and methylation site error rates. The architecture section shows a high level overview of the different models. Overview of the different tasks in the benchmark with their respective training and testing data (pink). Overview of the evaluation metrics in the benchmark (purple)
