Fig. 1
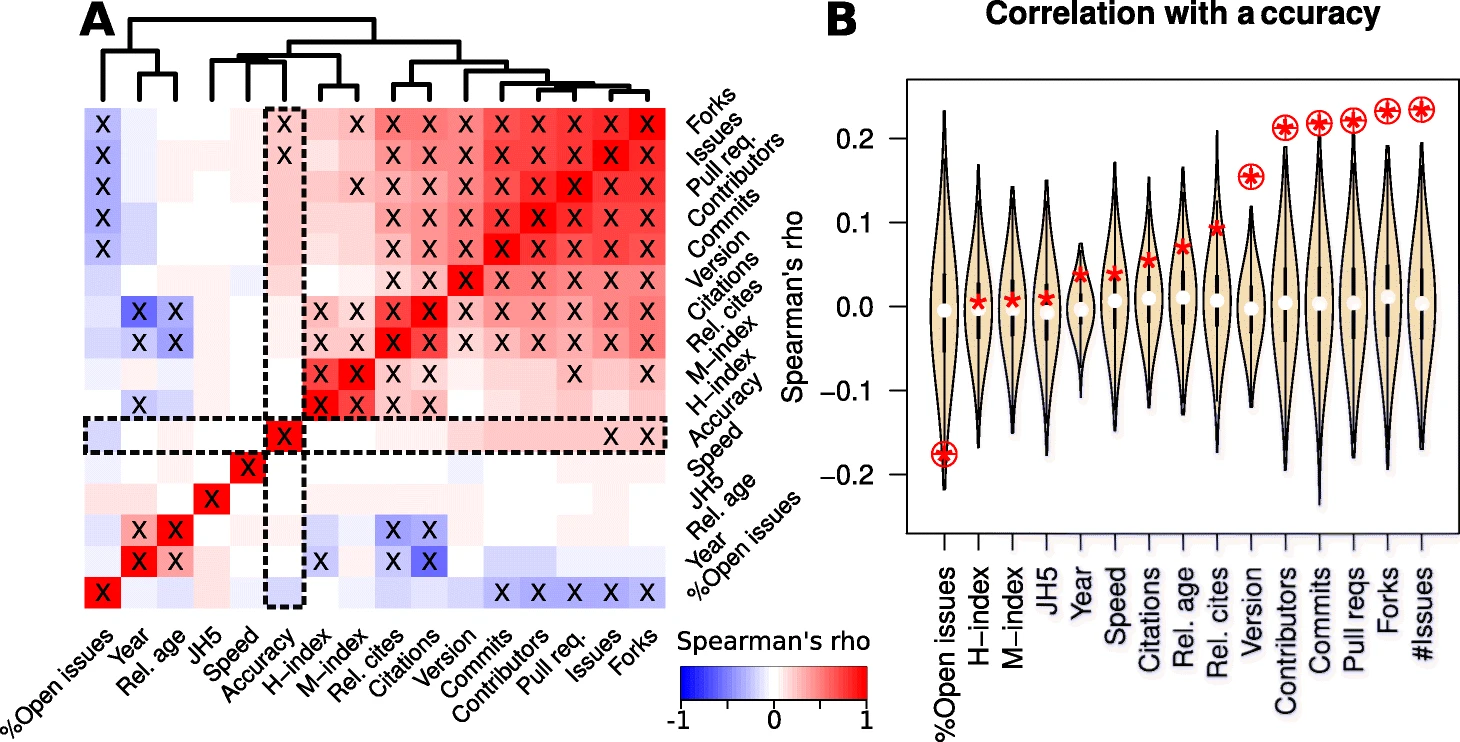
A A heatmap indicating the relationships between different features of bioinformatic software tools. Spearman’s rho is used to infer correlations between metrics such as citations based metrics, the year and relative age of publication, version number, GitHub derived activity measures, and the mean relative speed and accuracy rankings. Red colours indicate a positive correlation, blue colours indicate a negative correlation. Correlations with a P value less than 0.05 (corrected for multiple-testing using the Benjamini-Hochberg method) are indicated with a ‘X’ symbol. The correlations with accuracy are illustrated in more detail in B, the relationship between speed and accuracy is shown in more detail in Fig. 2. B Violin plots of Spearman’s correlations for permuted accuracy ranks and different software features. The unpermuted correlations are indicated with a red asterisk. For each benchmark, 1000 permuted sets of accuracy and speed ranks were generated, and the ranks were normalised to lie between 0 and 1 (see Methods for details). Circled asterisks are significant (empirical P value < 0.05, corrected for multiple-testing using the Benjamini-Hochberg method)