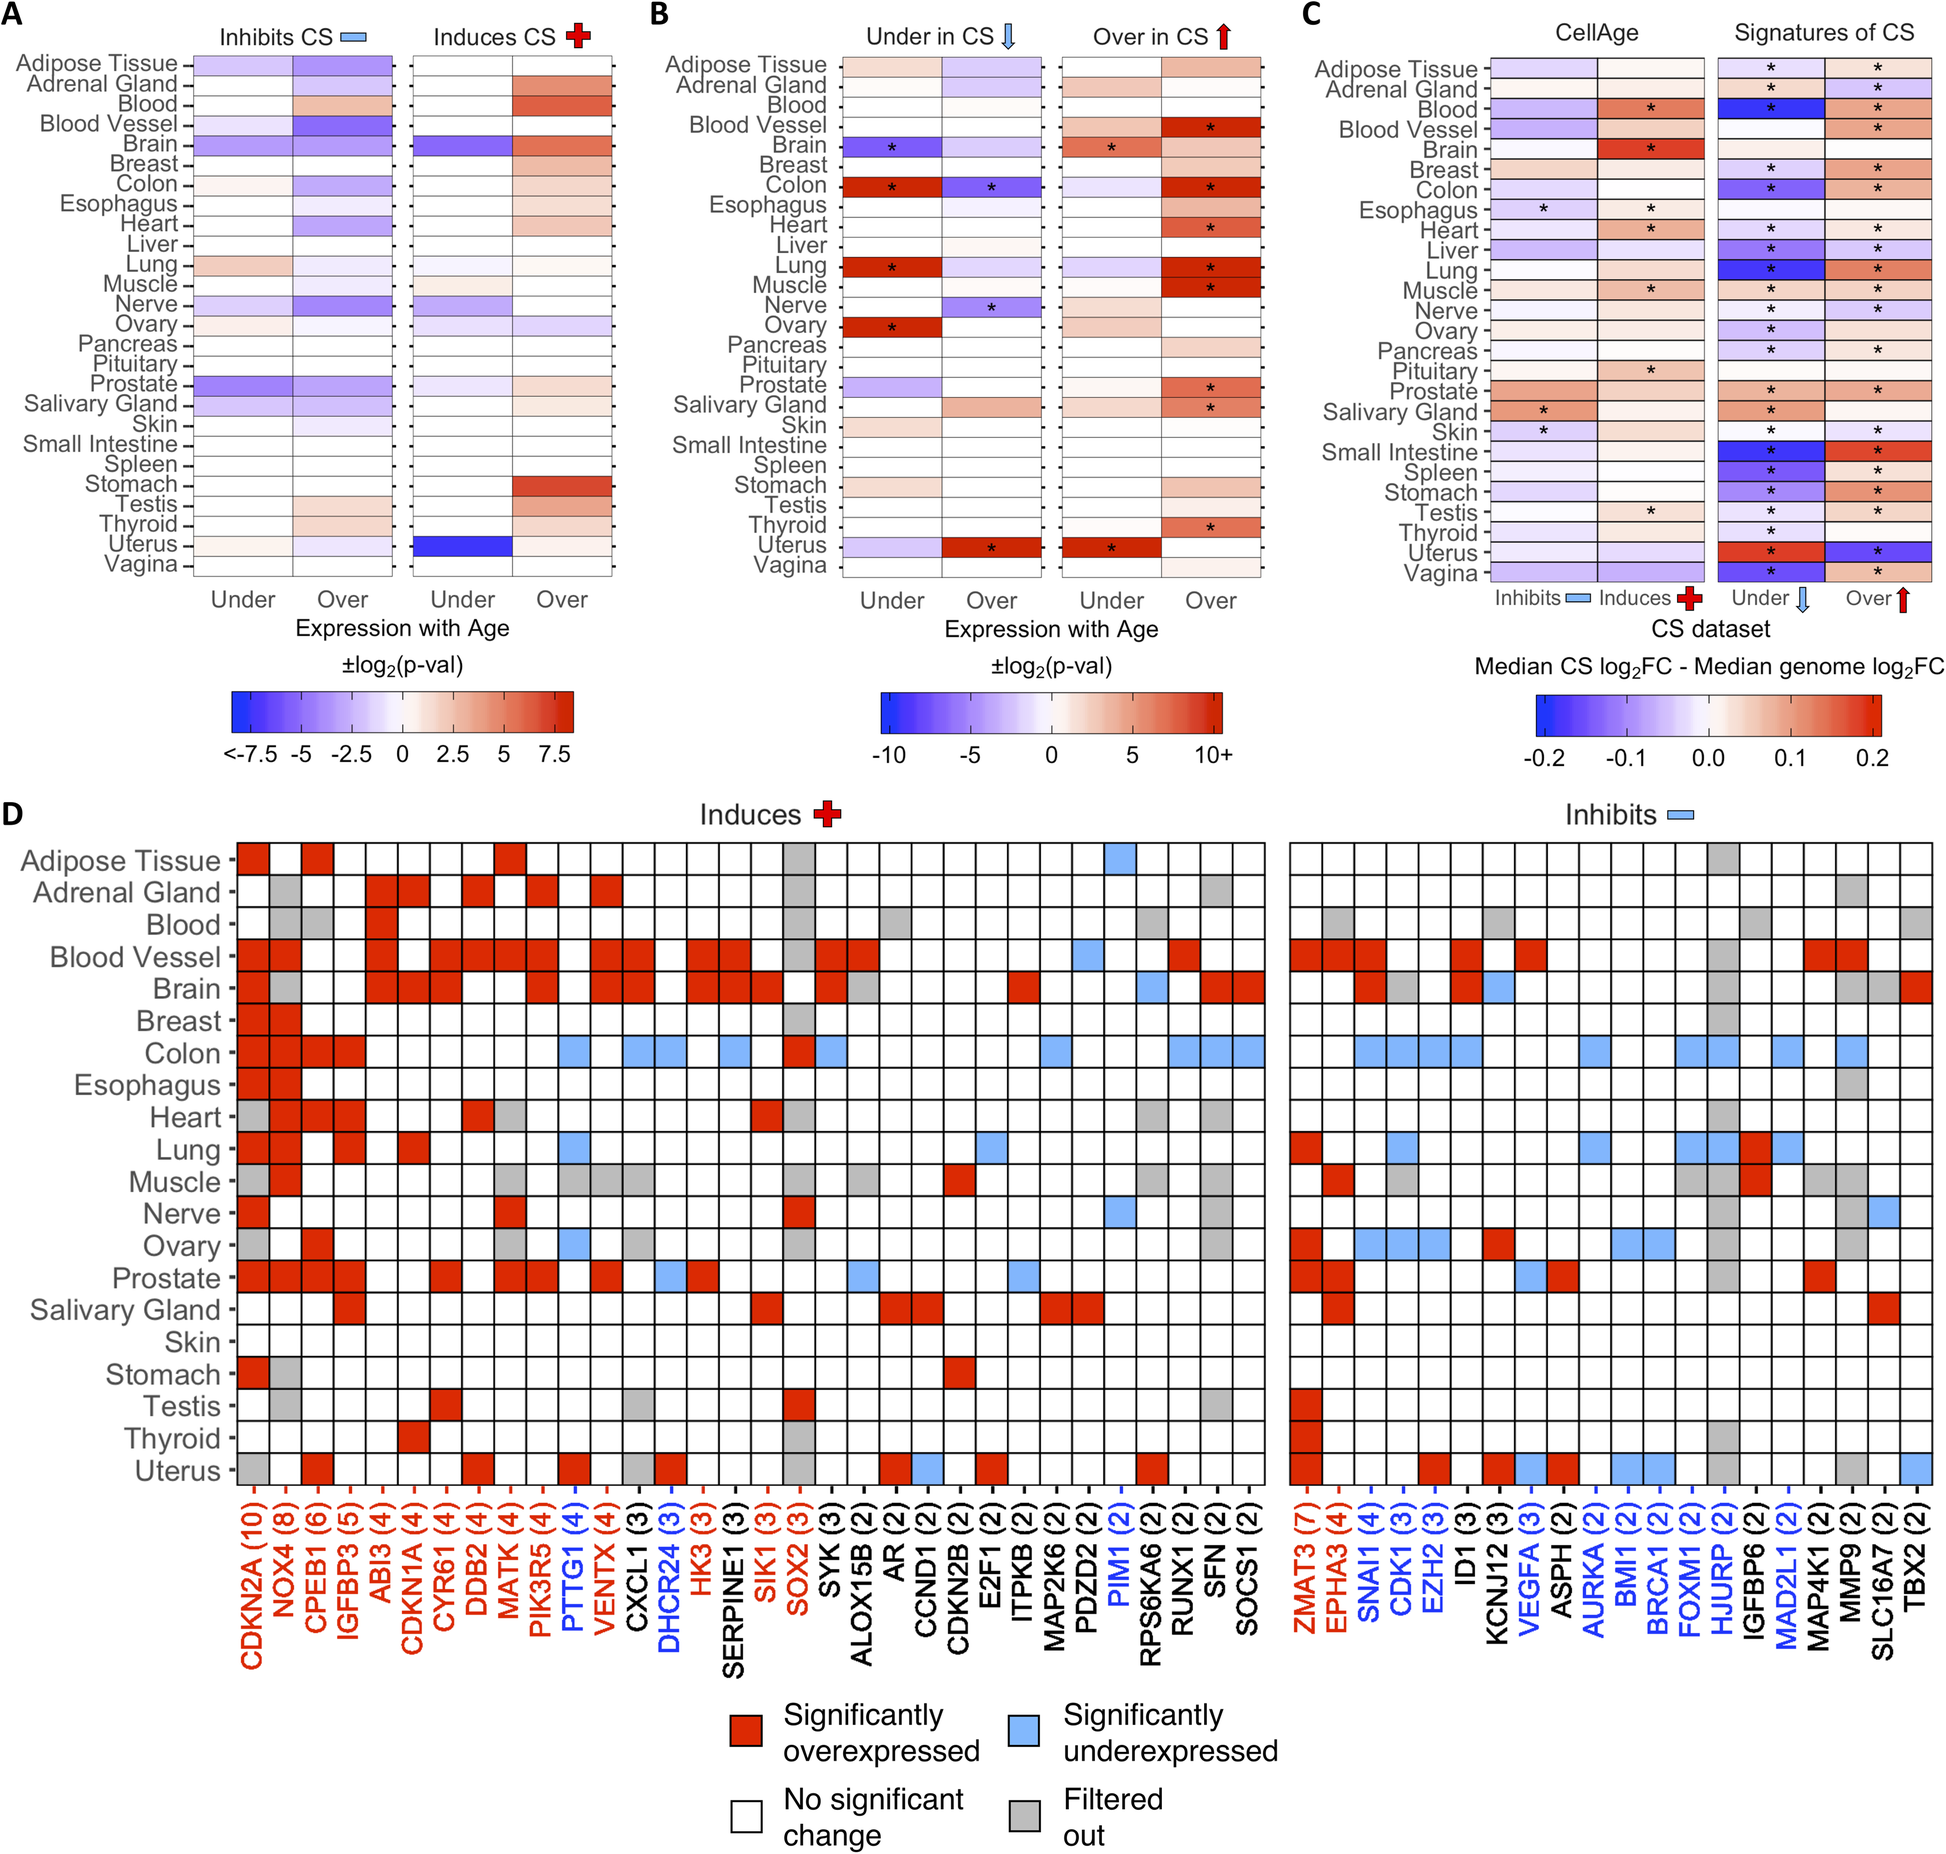
Fig. 2
From: A multidimensional systems biology analysis of cellular senescence in aging and disease

Differential expression of a CellAge inducers and inhibitors of CS and b differentially expressed signatures of CS in human tissues with age. Red values indicate that there were more genes differentially expressed with age than expected by chance (−log2(p-val)). Blue values indicate that there were less genes differentially expressed with age than expected by chance (log2(p-val)). Asterisks (*) denote tissues with significantly more CS genes differentially expressed with age (p < 0.05, Fisher’s exact test with BH correction, abs(50*log2FC) > log2(1.5)) (Additional file 1: Table S12 and S13). c Comparison of the median log2FC and distribution of log2FC with age between the CS genes and all protein-coding genes in human tissues. Red tiles indicate that the median log2FC of the CellAge and CS genes is higher than the median log2FC of all protein-coding genes for that tissue, while blue tiles indicate that the median log2FC of the CS genes is lower than the median genome log2FC. Asterisks (*) indicate significant differences between the log2FC distribution with age of CS genes and the log2FC distribution with age of all protein-coding genes for that tissue (p < 0.05, Wilcoxon rank sum test with BH correction) (Additional file 1: Table S16). d CellAge genes differentially expressed in at least two tissues with age. Gray tiles are genes which had low basal expression levels in the given tissue and were filtered out before the differential gene expression analysis was carried out [32]. Colored tiles indicate significant differential expression with age (p < 0.05, moderated t-test with BH correction, abs(50*log2FC) > log2(1.5)). Numbers by gene names in brackets denote the number of tissues differentially expressing the CellAge gene with age. Red gene names specify that the CellAge gene was significantly overexpressed with age in more tissues than expected by chance, while blue gene names show the CellAge genes significantly underexpressed with age in more tissues than expected by chance (p < 0.05, random gene expression tissue overlap simulations) (Additional file 1: Table S17 – S20). Liver, pancreas, pituitary, spleen, small intestine, and vagina did not have any significant CS DEGs with age
