Fig. 1
From: A multidimensional systems biology analysis of cellular senescence in aging and disease

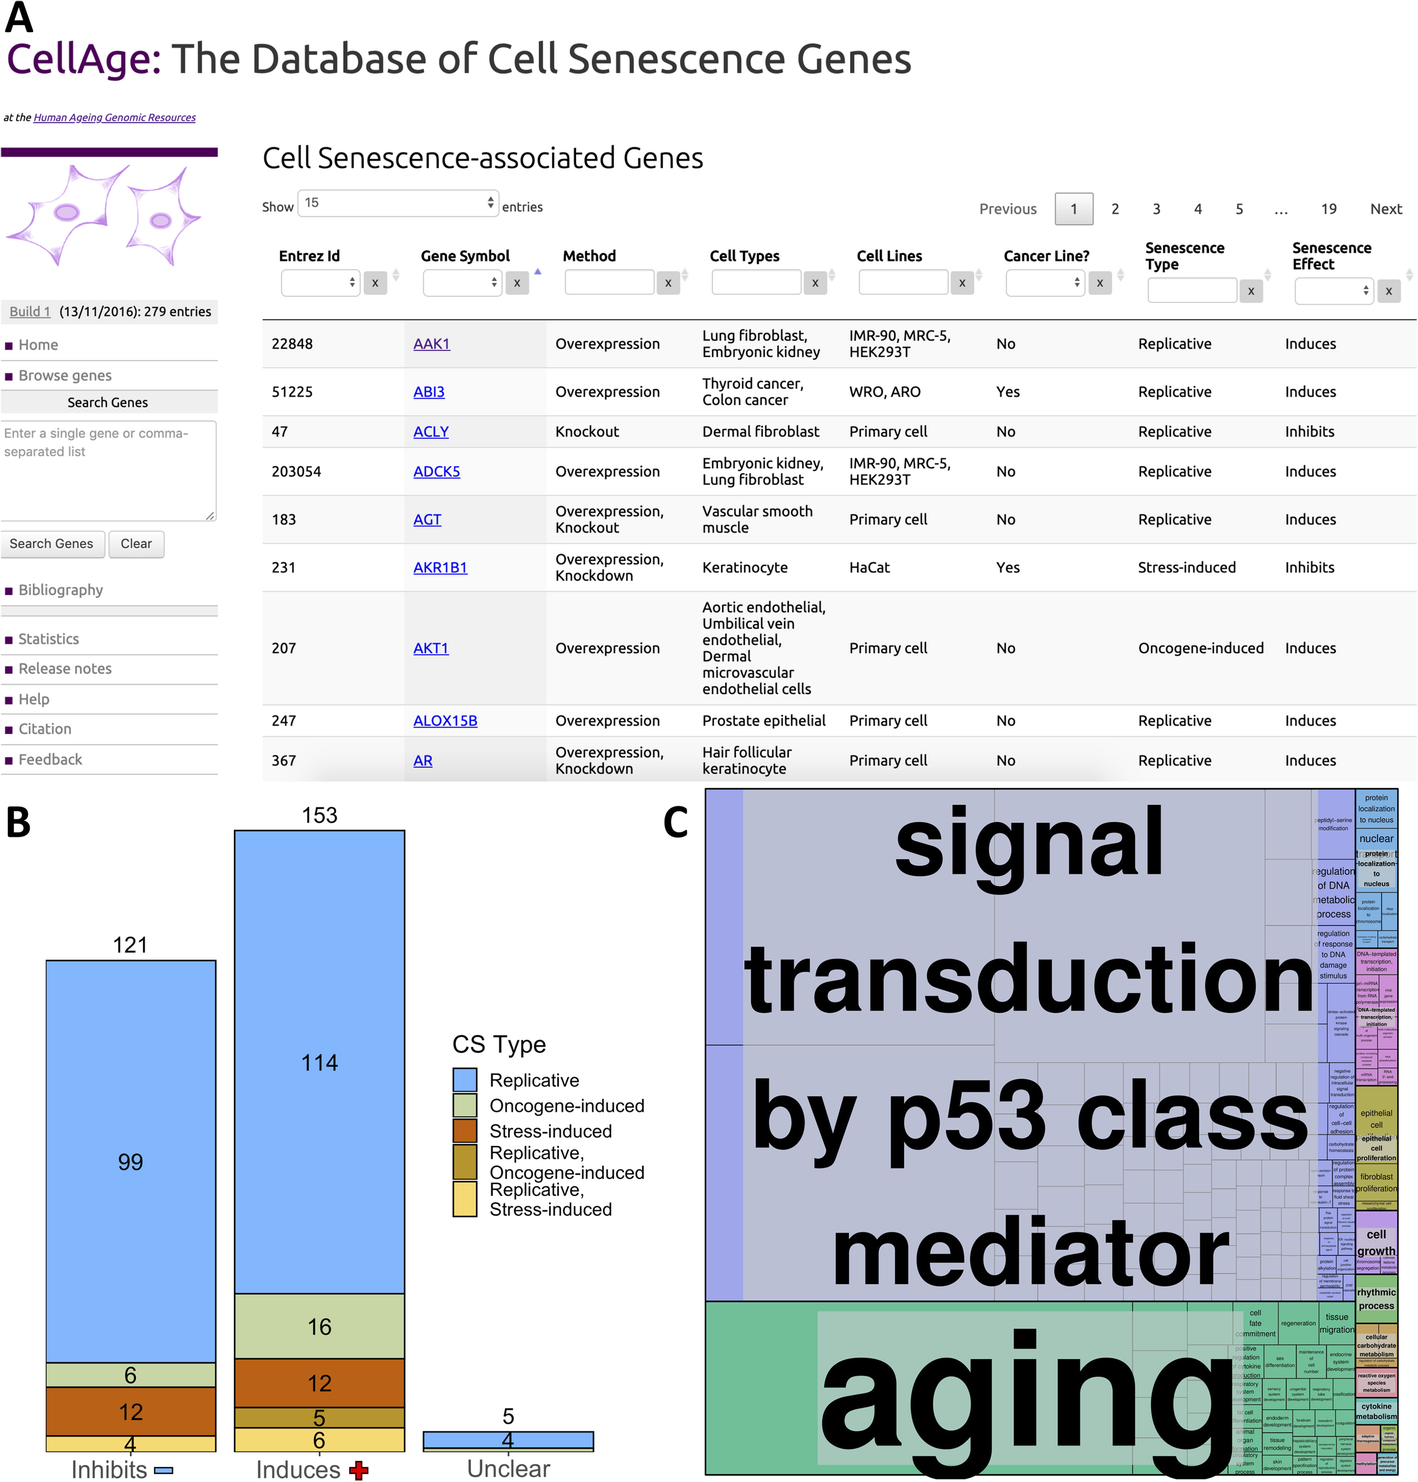
a The CellAge database of CS genes. The main data browser provides functionality to filter by multiple parameters like cell line and senescence type, and select genes to view details and links with other aging-related genes on the HAGR website. b Breakdown of the effects all 279 CellAge genes have on CS, and the types of CS the CellAge genes are involved in. Genes marked as “Unclear” both induce and inhibit CS depending on biological context. Numbers above bars denote the total number of genes inhibiting, inducing, or having unclear effects on CS. c Functional enrichment of the nonredundant biological processes involving the CellAge genes (p < 0.05, Fisher’s exact test with BH correction) (Additional file 1: Table S3). GO terms were clustered based on semantic similarities
