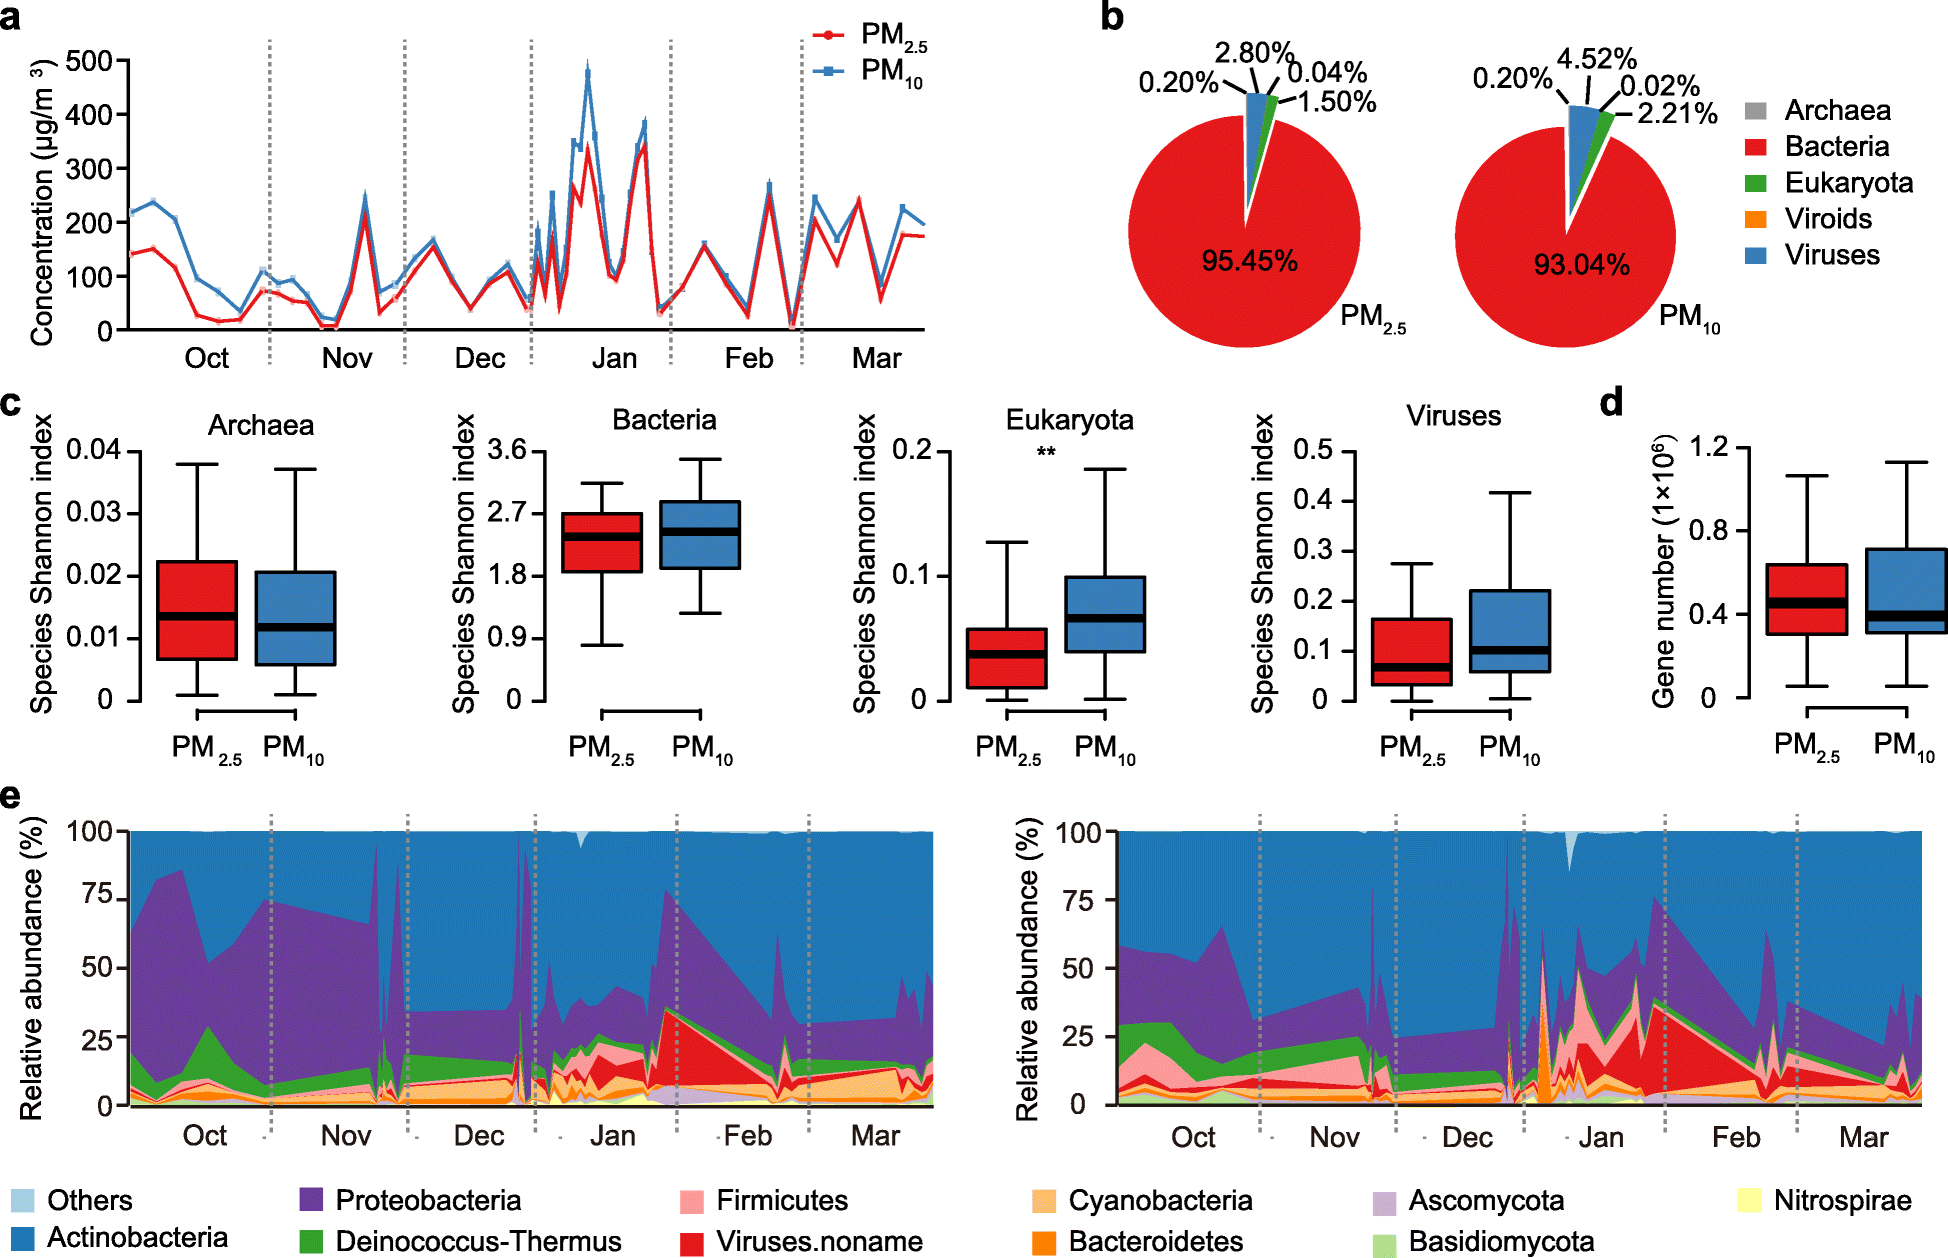
Fig. 1
From: Longitudinal survey of microbiome associated with particulate matter in a megacity

Taxonomic and functional characteristics of air microbiota. a Temporal distribution of daily PM concentration variations during the sampling period. b Relative abundance of different domains in air microbiome. c Taxonomic Shannon index of the PM2.5 (red) and PM10 (blue) samples. d Gene number of the PM2.5 (red) and PM10 (blue) samples. e Temporal distribution of relative abundance from the top 10 most abundant phyla across the sampling period of the PM2.5 (left) and PM10 (right) samples. Asterisks denote Wilcoxon signed-rank test results; P values were adjusted using Benjamini and Hochberg false discovery rate (FDR) (**adjusted P < 0.01)
