Fig. 2
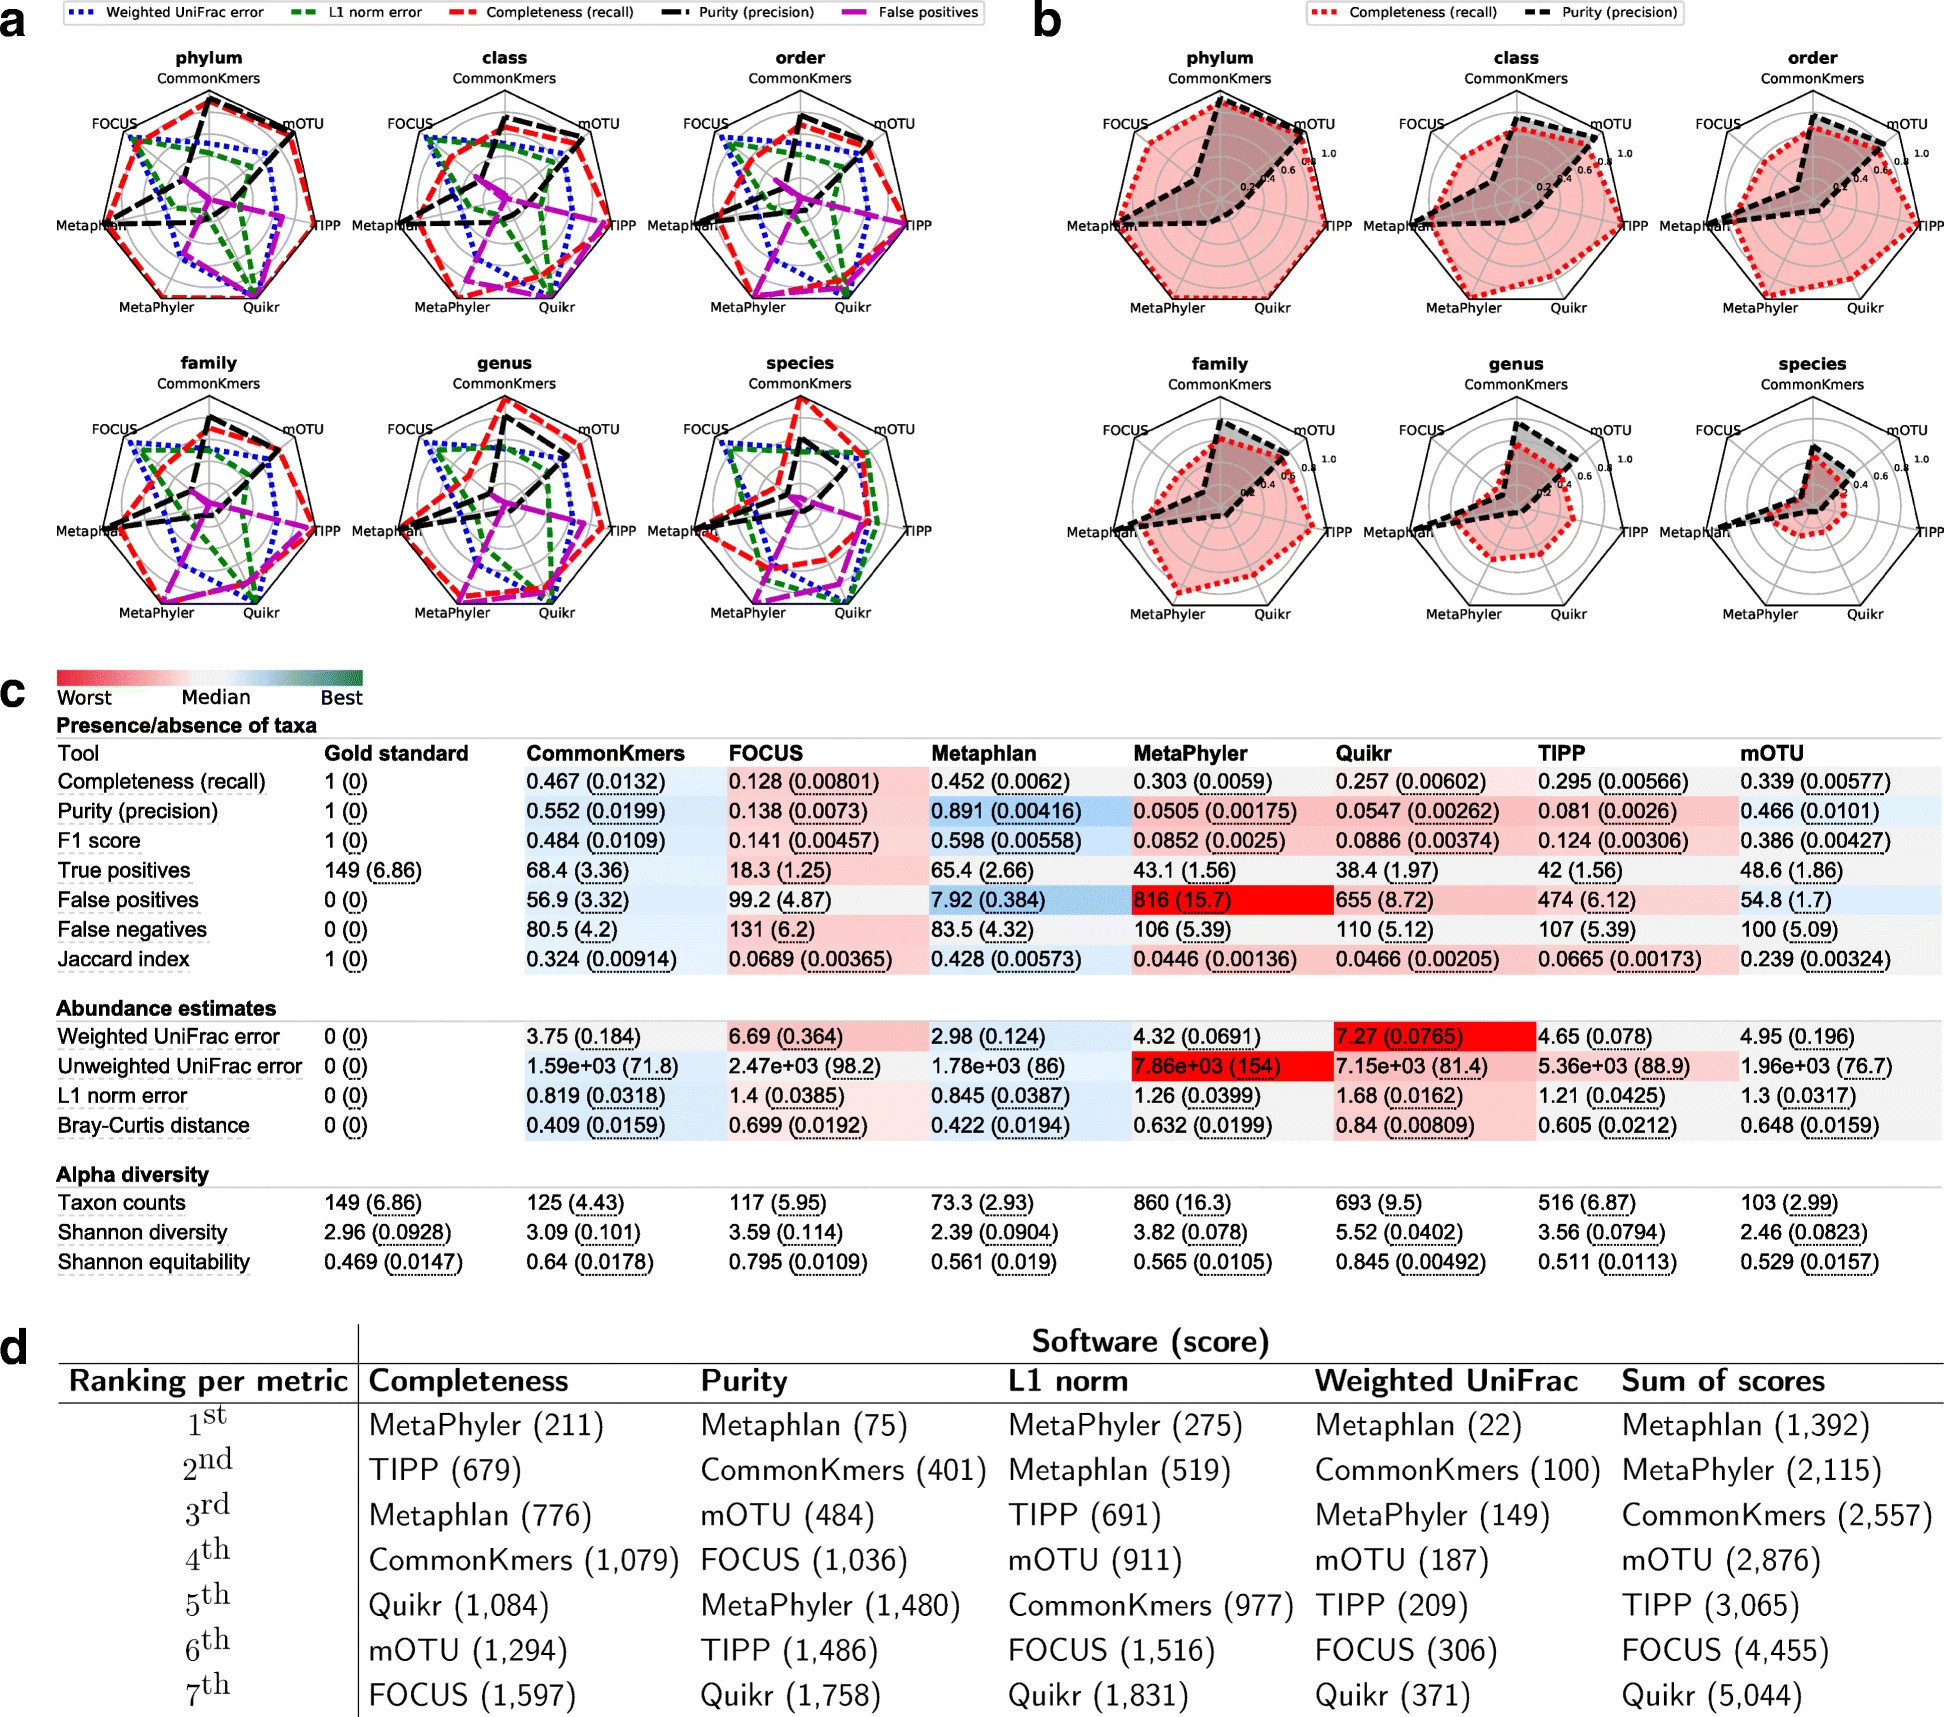
Assessment results on the CAMI II mouse gut dataset. a Relative performance plots with results for the metrics: weighted UniFrac, L1 norm, completeness, purity, and number of false positives at different taxonomic ranks. The values of the metrics in these plots are normalized by the maximum value attained by any profiler at a certain rank. b Absolute performance plots with results for the metrics completeness and recall, ranging between 0 and 1. c Results at the species level for all computed metrics, as output by OPAL in the produced HTML page. The values are averaged over the results for all 64 samples of the dataset, with the standard error being shown in parentheses. The colors indicate the quality of the prediction by a profiler with respect to a metric, from best (dark blue) to worst (dark red). d Rankings of the profilers according to their performance and scores for different metrics computed over all samples and taxonomic ranks