Fig. 3
From: Mash: fast genome and metagenome distance estimation using MinHash
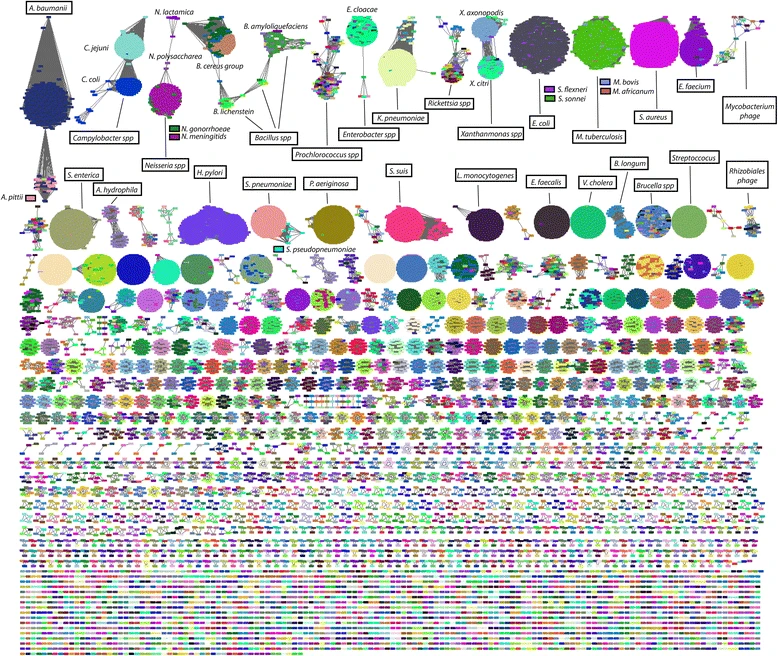
Comparison and de novo clustering of all RefSeq genomes using Mash. Each graph node represents a genome. Two genomes are connected by an edge if their Mash distance D ≤0.05 and P value ≤10–10. Graph layout was performed using Cytoscape [61] organic layout algorithm [62]. Individual nodes are colored by species and the top two rows of clusters have been annotated with the majority species label they contain. Only components containing microbial genomes are shown here (including viruses). Additional file 1: Figures S4 and S5 show eukaryotes, orphan plasmids, and organelles