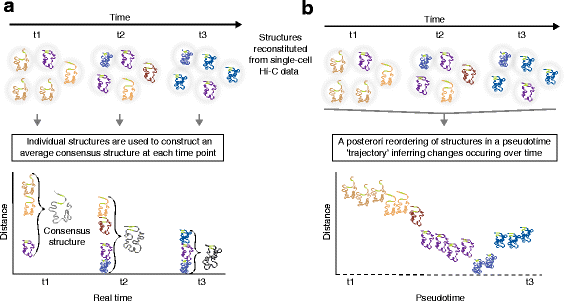
Fig. 4

Reconstitutions of chromosome structures in a time-series analysis of three-dimensional (3D) genome conformation: consensus structures at each time-point versus reconstruction of structures through a pseudotime trajectory. a 3D chromosome structures determined from Hi-C data in single cells in a time-series (time-points t1–t3) can be used to determine, at each time-point, an average consensus conformation. This approach can provide information on variance, provided that sufficient numbers of single cells are analyzed. The green portions in each structure mark two loci between which distance is assessed over time. Structures occurring more than once at the same time-point are highlighted in bold. In this scenario, heterogeneity of chromosome structures in the population of single cells compromises the analysis and conceals the actual dynamics in chromatin structure. b A posteriori computational re-ordering of chromosome structures inferred from single-cell Hi-C data. This exercise enables the reconstruction of a pseudotime trajectory of dynamic changes of the structures between the first and last time-points at which Hi-C data are collected. Reordering of chromosome structures aids in revealing their dynamics
