Figure 2
From: Moderated estimation of fold change and dispersion for RNA-seq data with DESeq2

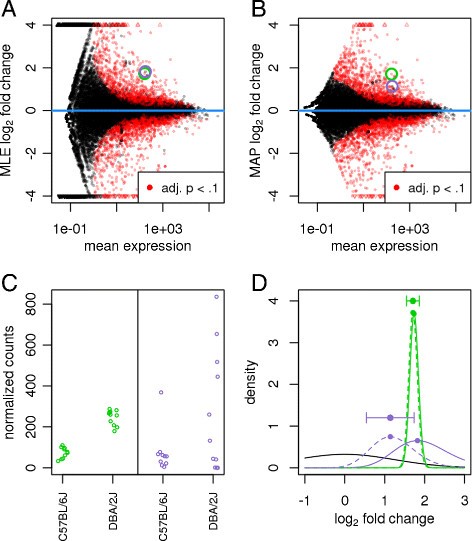
Effect of shrinkage on logarithmic fold change estimates. Plots of the (A) MLE (i.e., no shrinkage) and (B) MAP estimate (i.e., with shrinkage) for the LFCs attributable to mouse strain, over the average expression strength for a ten vs eleven sample comparison of the Bottomly et al. [16] dataset. Small triangles at the top and bottom of the plots indicate points that would fall outside of the plotting window. Two genes with similar mean count and MLE logarithmic fold change are highlighted with green and purple circles. (C) The counts (normalized by size factors s j ) for these genes reveal low dispersion for the gene in green and high dispersion for the gene in purple. (D) Density plots of the likelihoods (solid lines, scaled to integrate to 1) and the posteriors (dashed lines) for the green and purple genes and of the prior (solid black line): due to the higher dispersion of the purple gene, its likelihood is wider and less peaked (indicating less information), and the prior has more influence on its posterior than for the green gene. The stronger curvature of the green posterior at its maximum translates to a smaller reported standard error for the MAP LFC estimate (horizontal error bar). adj., adjusted; LFC, logarithmic fold change; MAP, maximum a posteriori; MLE, maximum-likelihood estimate.
