Figure 2
From: Gene ontology analysis for RNA-seq: accounting for selection bias

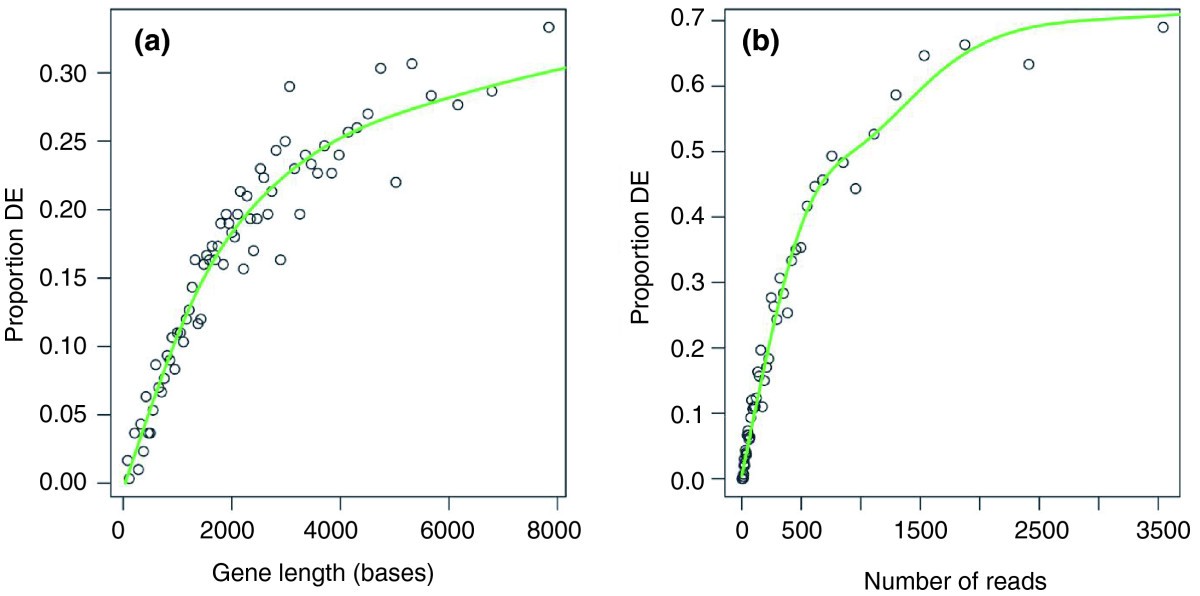
Differential expression as a function of gene length and read count. (a) The proportion of DE genes is plotted as a function of the transcript length. Each point represents the percentage of genes called DE in a bin of 300 genes plotted against the median gene length for the bin. The green line is the probability weighting function obtained by fitting a monotonic cubic spline with 6 knots to the binary data. A clear trend towards more detected differential expression at longer gene lengths can be seen. (b) The same, except instead of transcript length, the total number of reads for each gene was used. Again, a trend towards more DE for genes with more reads can be seen. Note the greater range of probabilities compared to (a).
