Figure 1
From: Gene ontology analysis for RNA-seq: accounting for selection bias

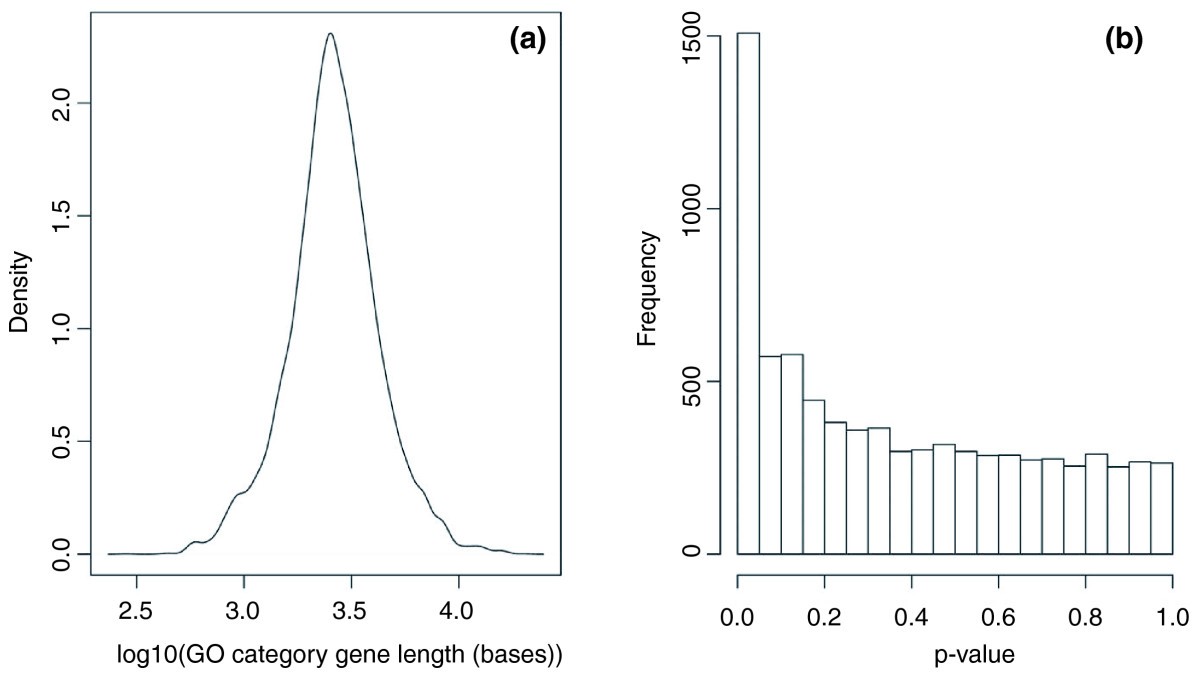
Length distribution of genes in Gene Ontology categories. (a) The distribution of average gene lengths in GO categories on a log10 scale. The GO category gene length is given by the median length of the genes within the category. (b) P-values for the two-sided Mann-Whitney U test comparing the median length of genes in a GO category with the overall distribution of genes for 7,873 GO categories. The excess of low P-values shows that there are many GO categories that contain a set of significantly long or short genes.
