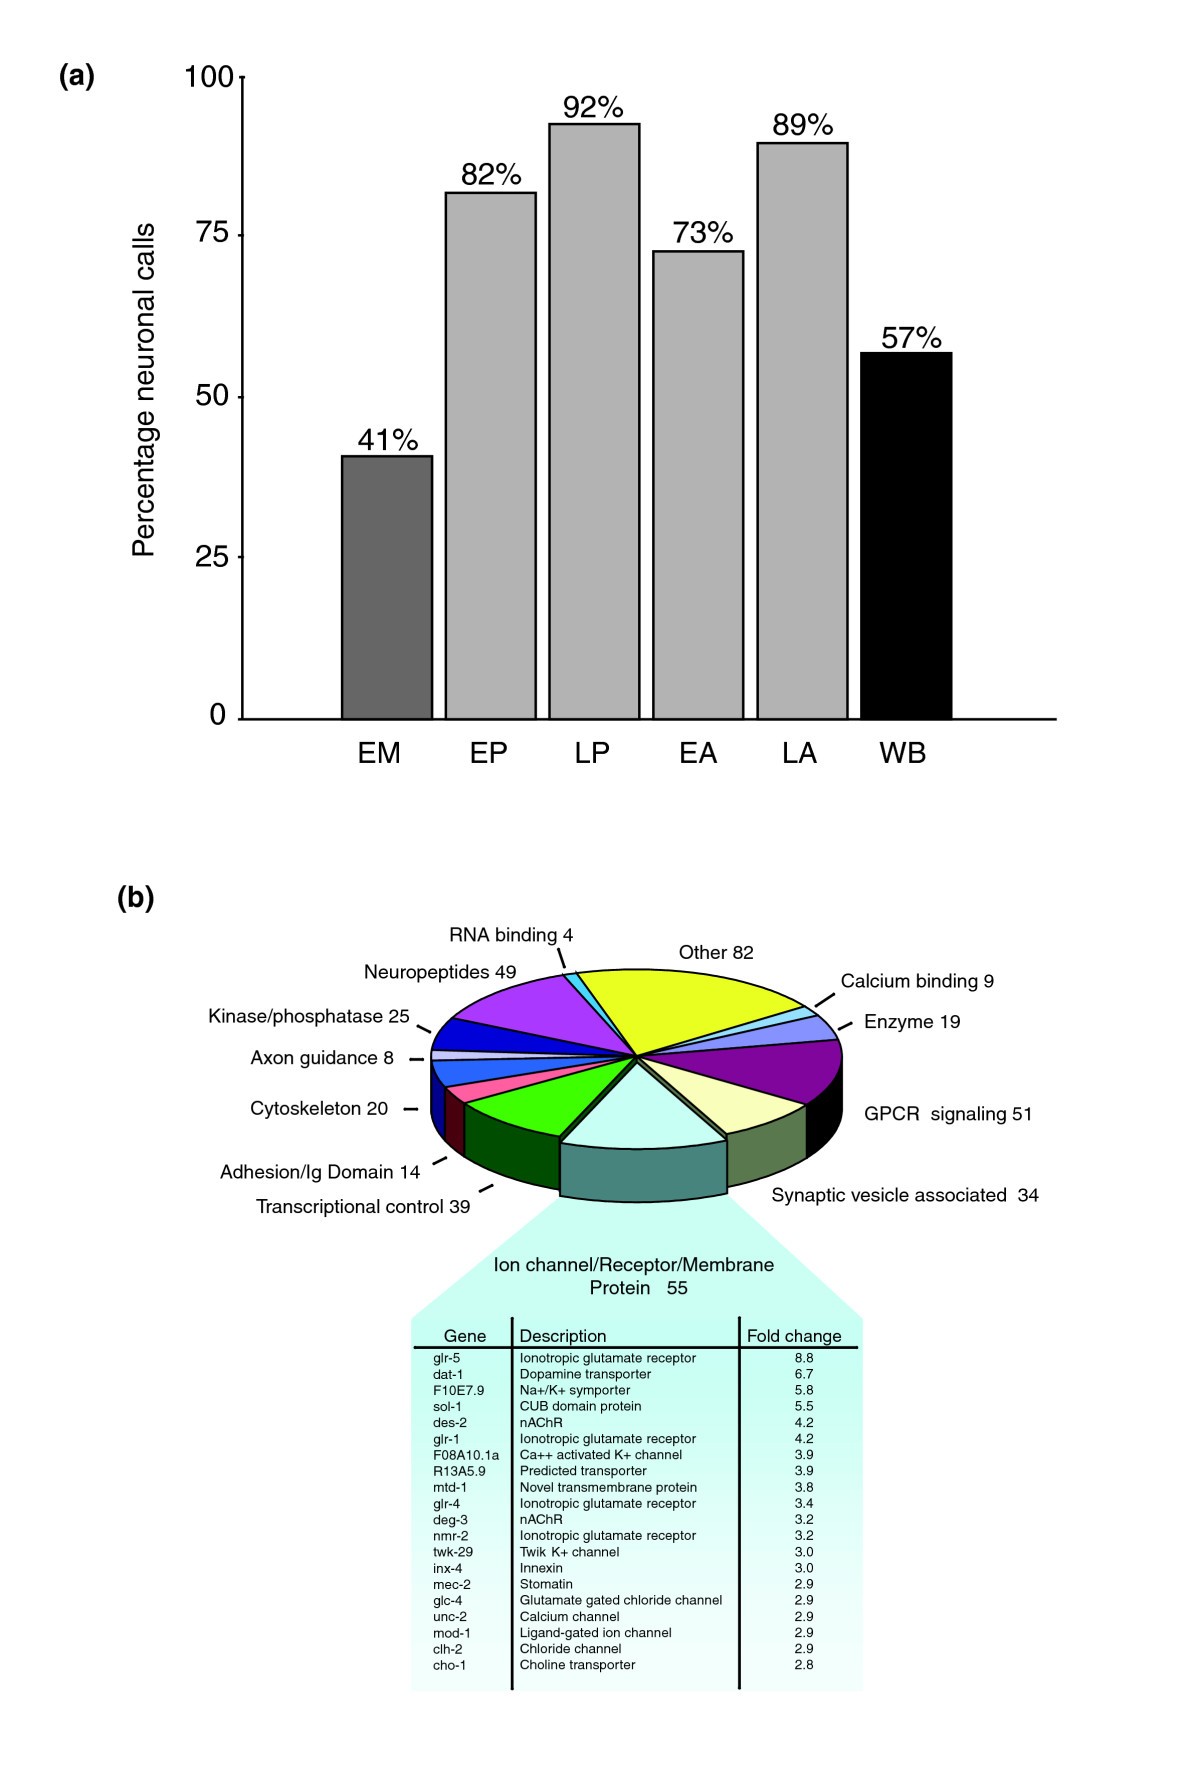
Figure 3

Microarray profiles detect known C. elegans neural genes. (a) Histogram showing fraction of annotated genes in microarray datasets with known in vivo expression in neurons. The list of annotated genes used for this comparison includes all genes with known cellular expression patterns listed in WormBase (see Materials and methods). Note significant enrichment for neuronal genes in microarray datasets obtained from neurons (73-92%) relative to the fraction of all annotated genes in WormBase (57%) and embryonic muscle (41%) that show some expression in the nervous system. Microarray datasets are: EM, embryonic muscle; EP, embryonic pan-neural; LP, larval pan-neural; EA, embryonic A-class motor neuron; LA, larval A-class motor neuron; WB, WormBase. (b) The larval pan-neural enriched dataset contains 443 transcripts previously annotated as expressed in neurons in WormBase. Genes were grouped according to functional categories characteristic of neurons. The top 20 enriched ion channel/receptor/membrane proteins are featured (Additional data file 7).
