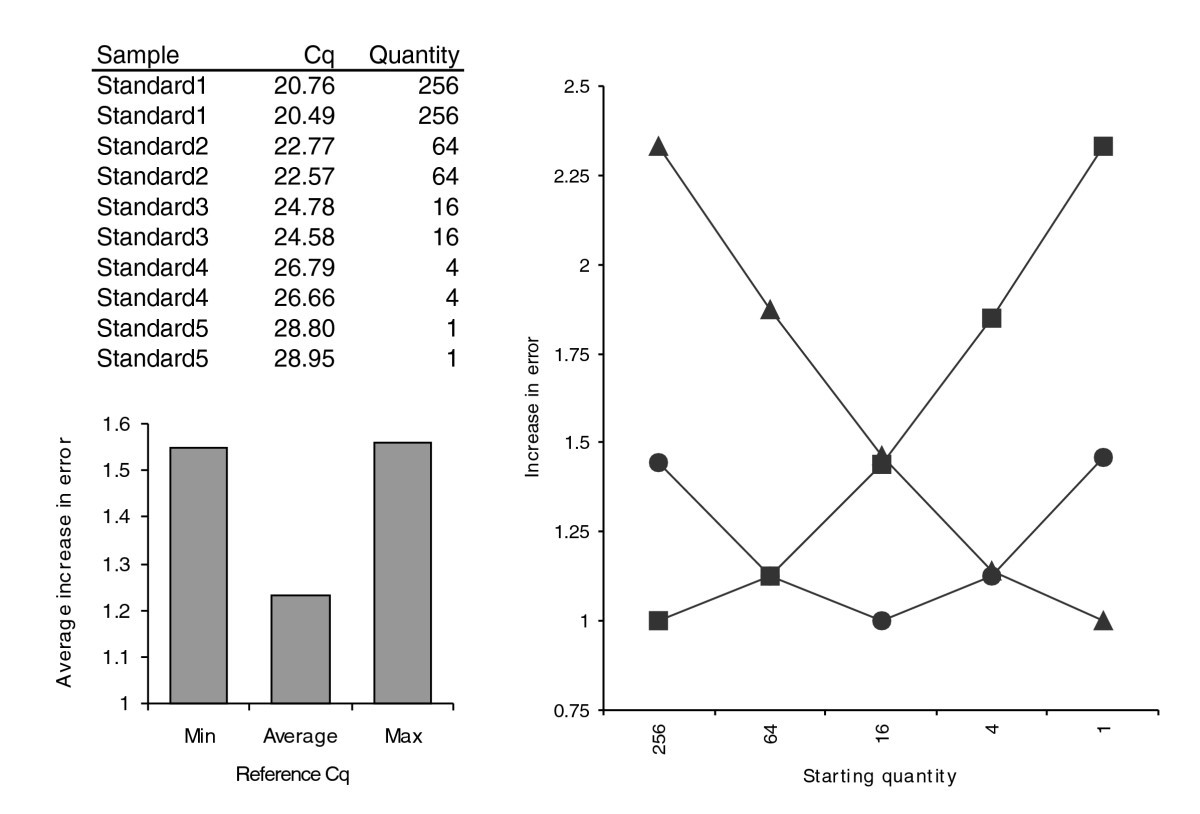
Figure 1

Effect of reference quantification cycle value on increase in error. Relative quantities were calculated for a simulated experiment with a five point four-fold dilution series using, respectively, the lowest Cq (squares), the average Cq (circles) or the highest Cq (triangles) as the reference quantification cycle value. Cq and quantity values are shown at the top left. The increase in the error on relative quantities for the different samples is shown at the top right, with the average increase depicted on the lower left graph.
