Fig. 4
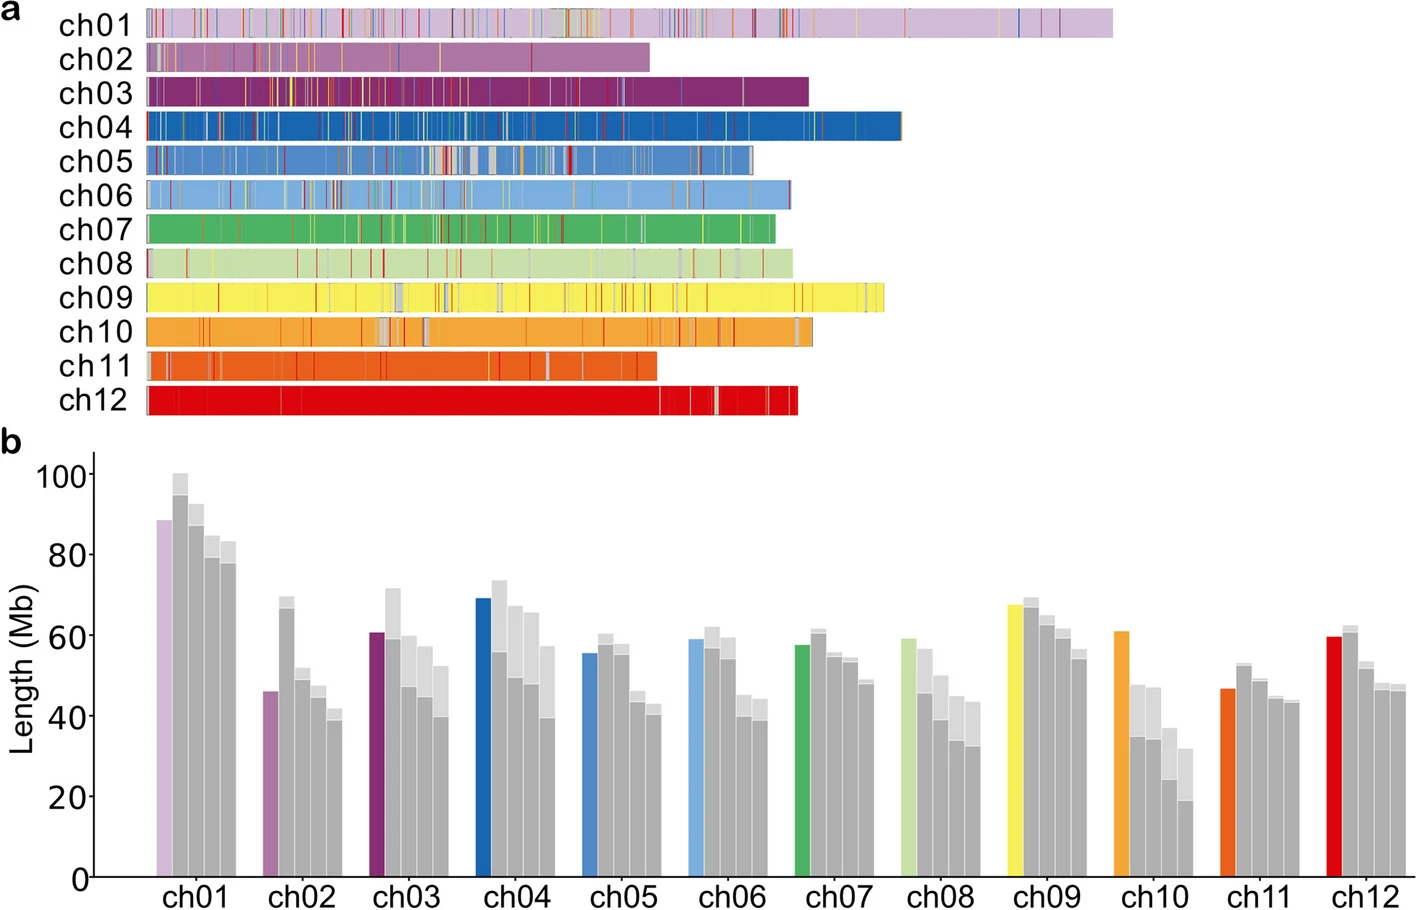
Clustering results. a The contigs of each chromosome cluster are mapped to the reference sequence DMv6.1, and the mapped interval is colored accordingly. A different color is used for each cluster. Ideally, one chromosome contains a single color. b Length comparison of the four haplotypes (gray bars) compared to the reference (colored bars). The length is computed as the sum of the contig lengths for all contigs in a haplotype cluster. We have added the information on how much node sequence was included in the first clustering step to form the chromosomal cluster, but had to be excluded from the second step of phased clustering due to not being phase informative (= lacking the unique k-mer information), marked by the light gray bars atop of each cluster size bar. This visualization distributes the unphased sequence uniformly to each haplotype cluster. Note that the true assignment to haplotypes is, by definition, unknown for the unphased sequence