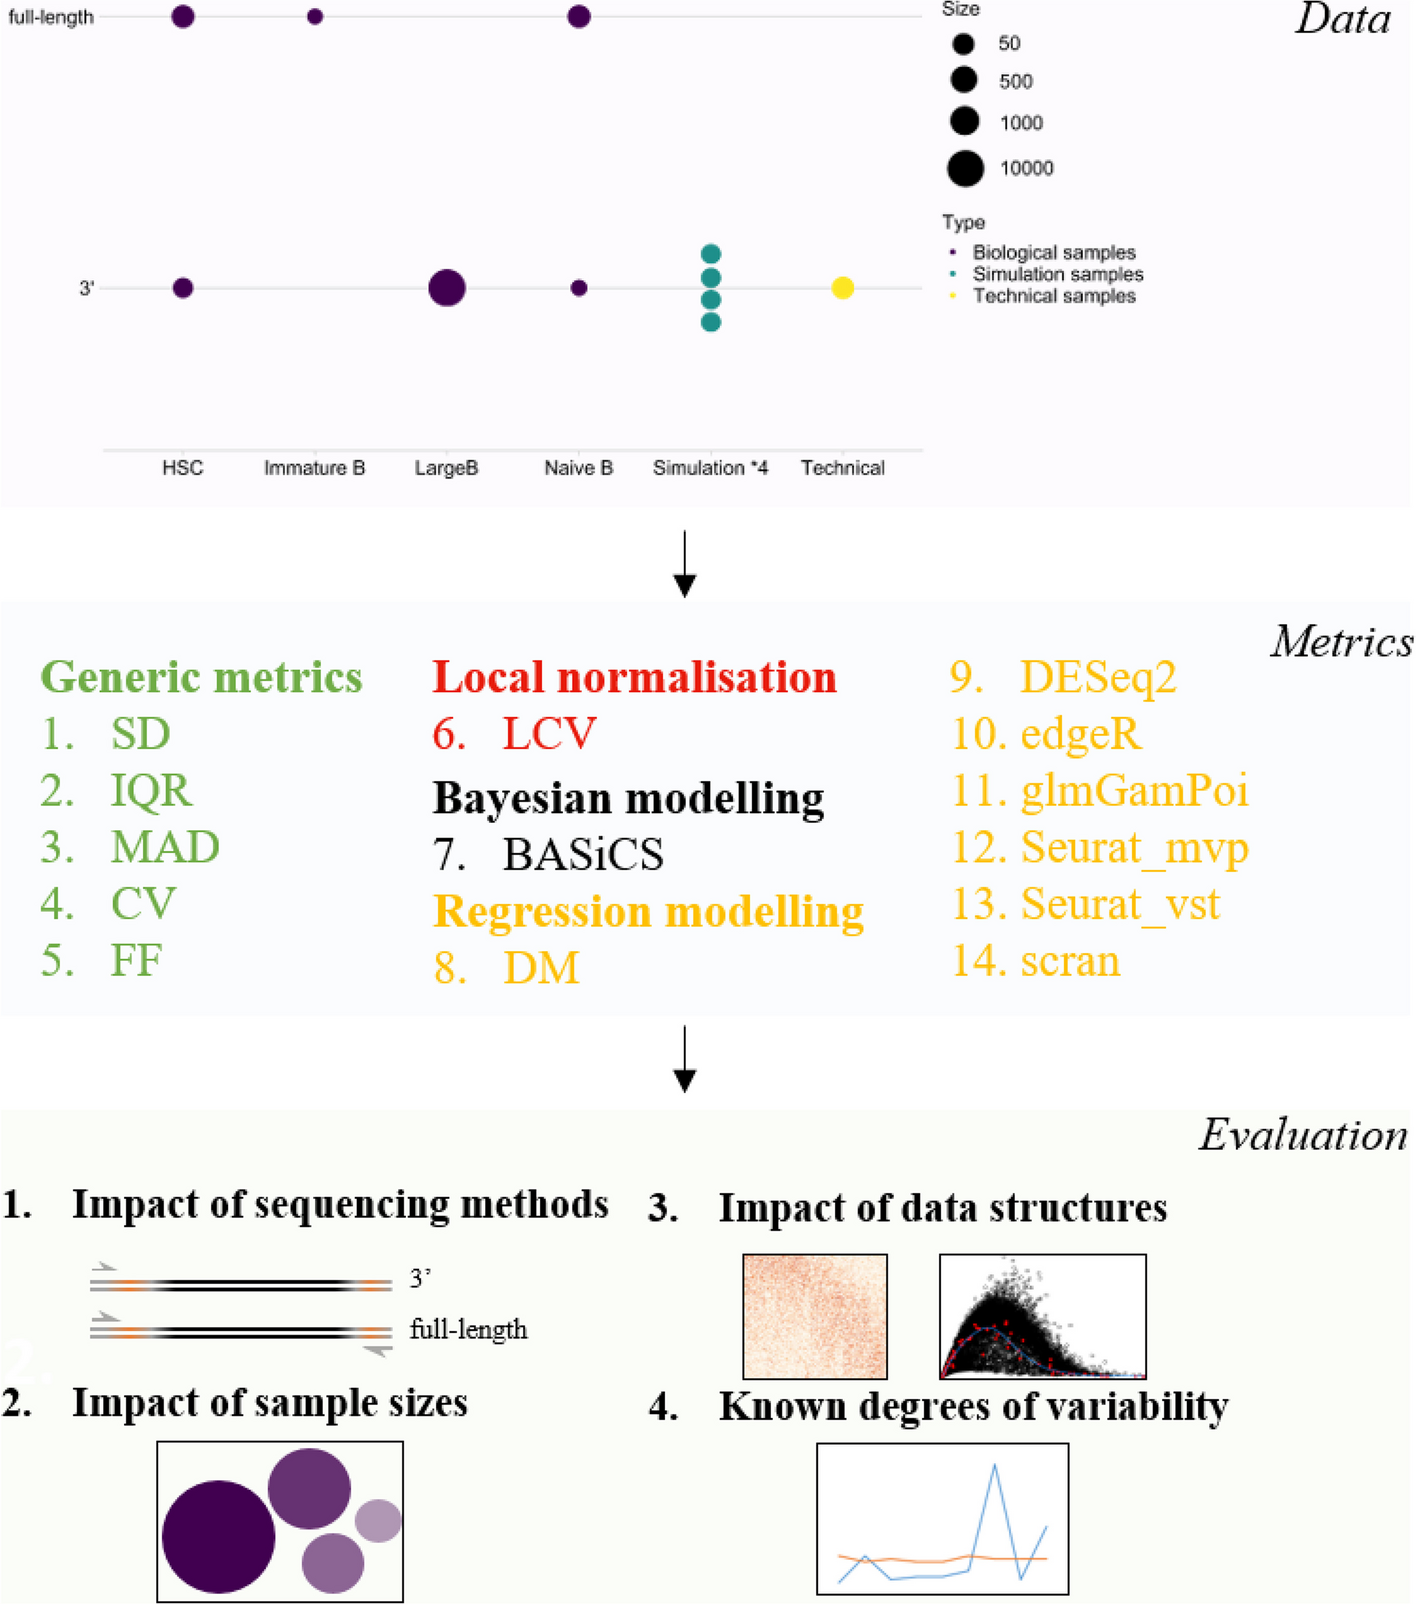
Fig. 1

Schematic summaries of the benchmark workflow to evaluate the performance of cell-to-cell variability metrics for scRNA-seq data. A panel of 14 metrics that perform the estimation of cell-to-cell variability were evaluated on both experimentally-derived and simulated data from two main sequencing platforms with different sample sizes. Evaluation includes the impact of sequencing platforms, sample sizes, data structures, and the recapitulation of known degrees of variability. Other than generic metrics, other metrics are designed for analyzing transcriptomic data and implemented following package tutorials. All metrics can be processed through the wrapper method scVar [17]
